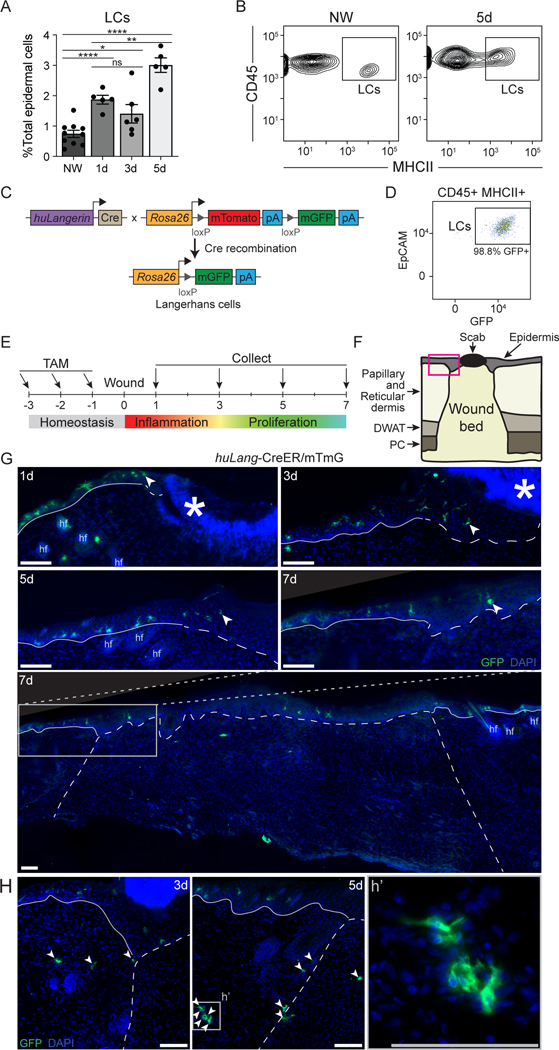
Figure 3: LCs localize at the epidermal and dermal edges of skin wounds.
(A) Flow cytometry quantification of LCs in nonwounded (NW) epidermis and epidermal edges of WT skin wounds 1, 3, and 5 days after injury. LCs quantified as a percent of total epidermal cells Data are 5–9 mice as indicated. Error bars indicate mean +/− SEM. two-way ANOVA, multiple comparisons with each timepoint, *p < 0.05, **p < 0.005, ***p < 0.0005, ****p < 0.00005.
(B) Representative flow cytometry plots of LCs (CD45+ MHCII+ epidermal cells) in nonwounded epidermis (NW, left) and at the edges of 5-day wounds (5d, right) in WT mice.
(C) Schematic summarizing genetic strategy to express membrane-associated GFP (mGFP) in mature LCs in huLang-CreER/mTmG (LC-iGFP) inducible fluorescent reporter mice.
(D) Representative flow cytometry plot demonstrating the efficiency of GFP labeling of mature LCs (CD45+ MHCII+ epidermal cells) in LC-iGFP mice.
(E) Schematic depicting tamoxifen treatment timeline and wound healing time points for histological analysis of LC-iGFP mice.
(F) Schematic of skin wound cross-section. Pink box outlines the epidermal wound edge. DWAT = dermal white adipose tissue, PC = panniculus carnosus.
(G) Fluorescent imaging of GFP+ LCs (green) and DAPI (blue) in epidermal wound edges 1, 3, 5, and 7 days after injury in LC-iGFP mice. Solid white lines trace the non-wounded epidermis, and the dashed white lines delineate the wound bed. White arrows label the LC closest to the wound center. Asterisks indicate non-specific labeling of scab, hair follicles (hf). Scale bars, 100 μm.
(H) Fluorescent imaging of GFP+ LCs in the dermis at wound edges of 3- and 5-day wounds. White arrows label LCs in dermis and wound bed. White dashed lines delineate wound edges. Scale bars, 100 μm. See also Figure S4.

