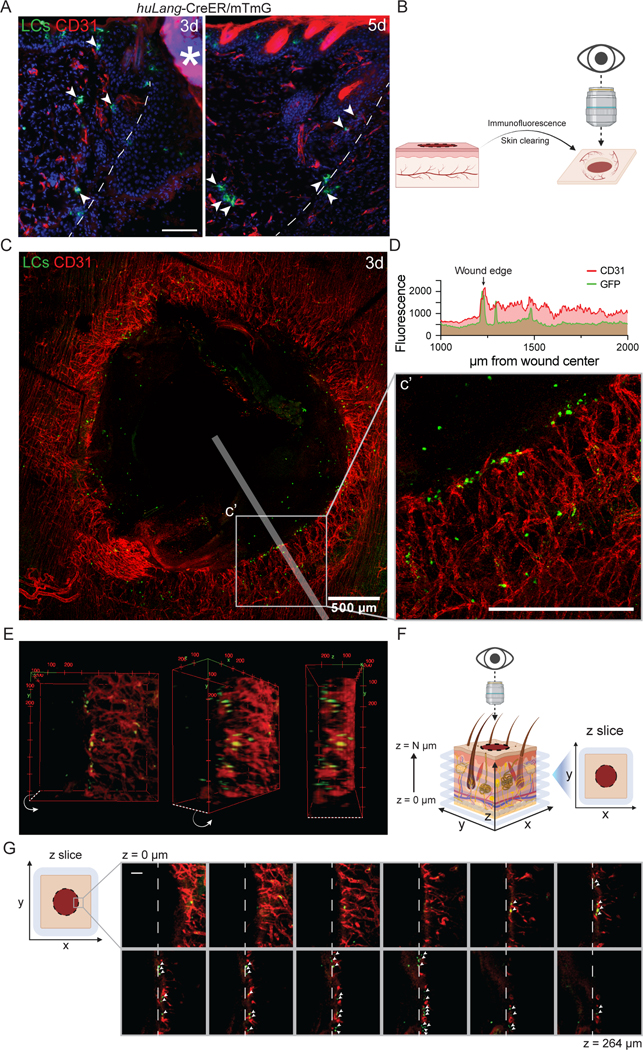
Figure 4: Langerhans cells localize near tips of regenerating blood vessels during wound healing.
(A) Imaging of GFP+ LCs (green) and immunostaining of CD31+ blood vessels (red) in cross-sections of 3- and 5-day wounds from LC-iGFP mice. Arrows label LCs close to blood vessels. White dashed lines delineate wound edges. Asterisks (*) indicates non-specific labeling of scab. Scale bars, 100 μm.
(B) Schematic depicting the orientation of 3-dimensional wound beds for whole mount confocal microscopy.
(C) Maximum intensity projection of confocal imaging of CD31+ blood vessels (red) and GFP+ LCs (green) in 3-day whole mount wounds of LC-iGFP mice. Transparent white line depicts line scan path quantified in D. Scale bar, 500 μm.
(D) Quantification of CD31 (red) and GFP (green) fluorescence in line scan (75 μm wide) along wound radius. Arrow indicates wound edge.
(E) 3-Dimensional volume rendering of CD31+ blood vessels (red) and GFP+ LCs (green) at the edges of a 3-day wounds in LC-iGFP mice.
(F) Schematic depicting the orientation of optical z-slices acquired from confocal microscopy of whole mount wound beds.
(G) Montage of z-slice images from deep (z = 0 μm) to superficial (z = 264 μm) depth of a 3-day LC-iGFP wound bed. White arrows indicate GFP+ LCs (green) close to CD31+ (red) blood vessels at the wound leading edge (white dashed lines). Scale bar, 100 μm.

