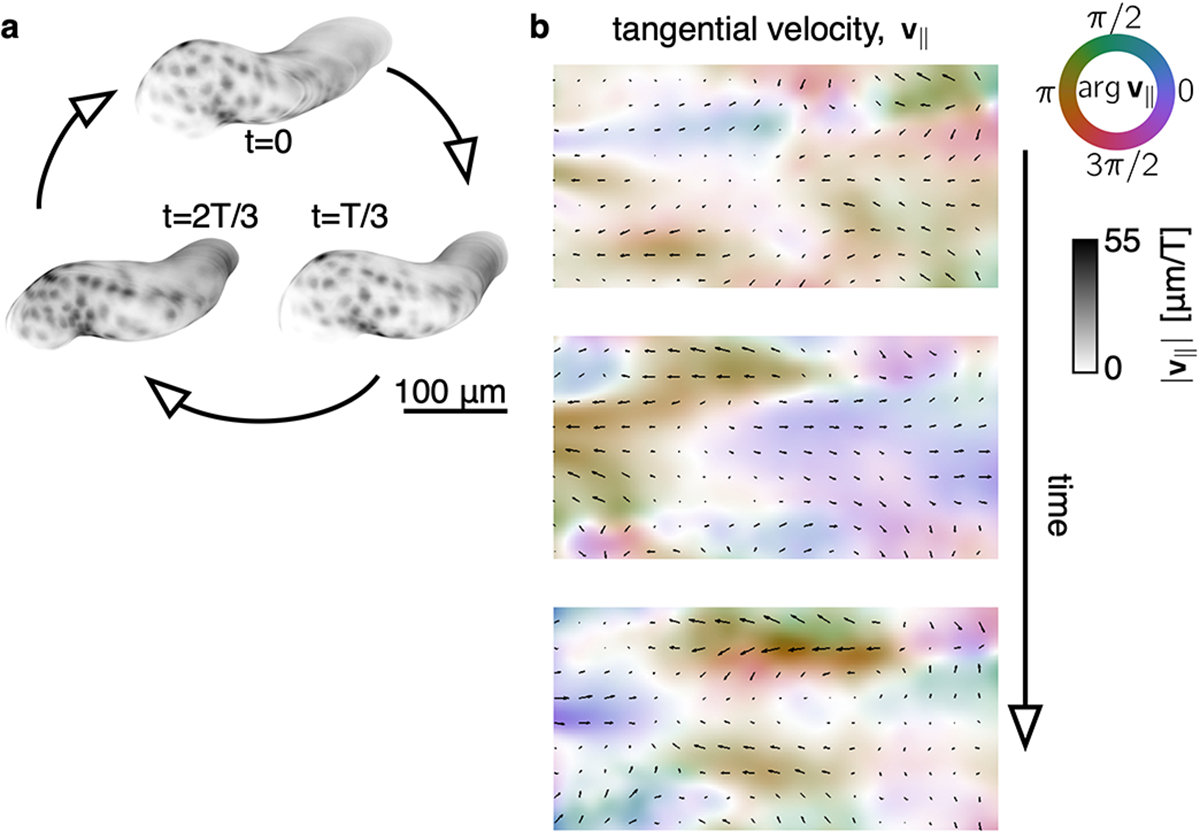
FIG. Extended Data Fig. 5. TubULAR reveals the tangential deformations of a beating embryonic zebrafish heart.

a, A rendering of cardiomyocyte fluorescence via TexturePatch shows cyclic deformations with a beat period, . See also Fig. 4a. b, TubULAR maps the tangential component of the 3D velocity field onto the pullback plane. Color denotes the tangential velocity direction along the long axis (purple or orange) or along the circumferential axis (green or red). The opacity of the rendered image reflects the magnitude of the tangential velocity, as do the length of overlaid black arrows.
