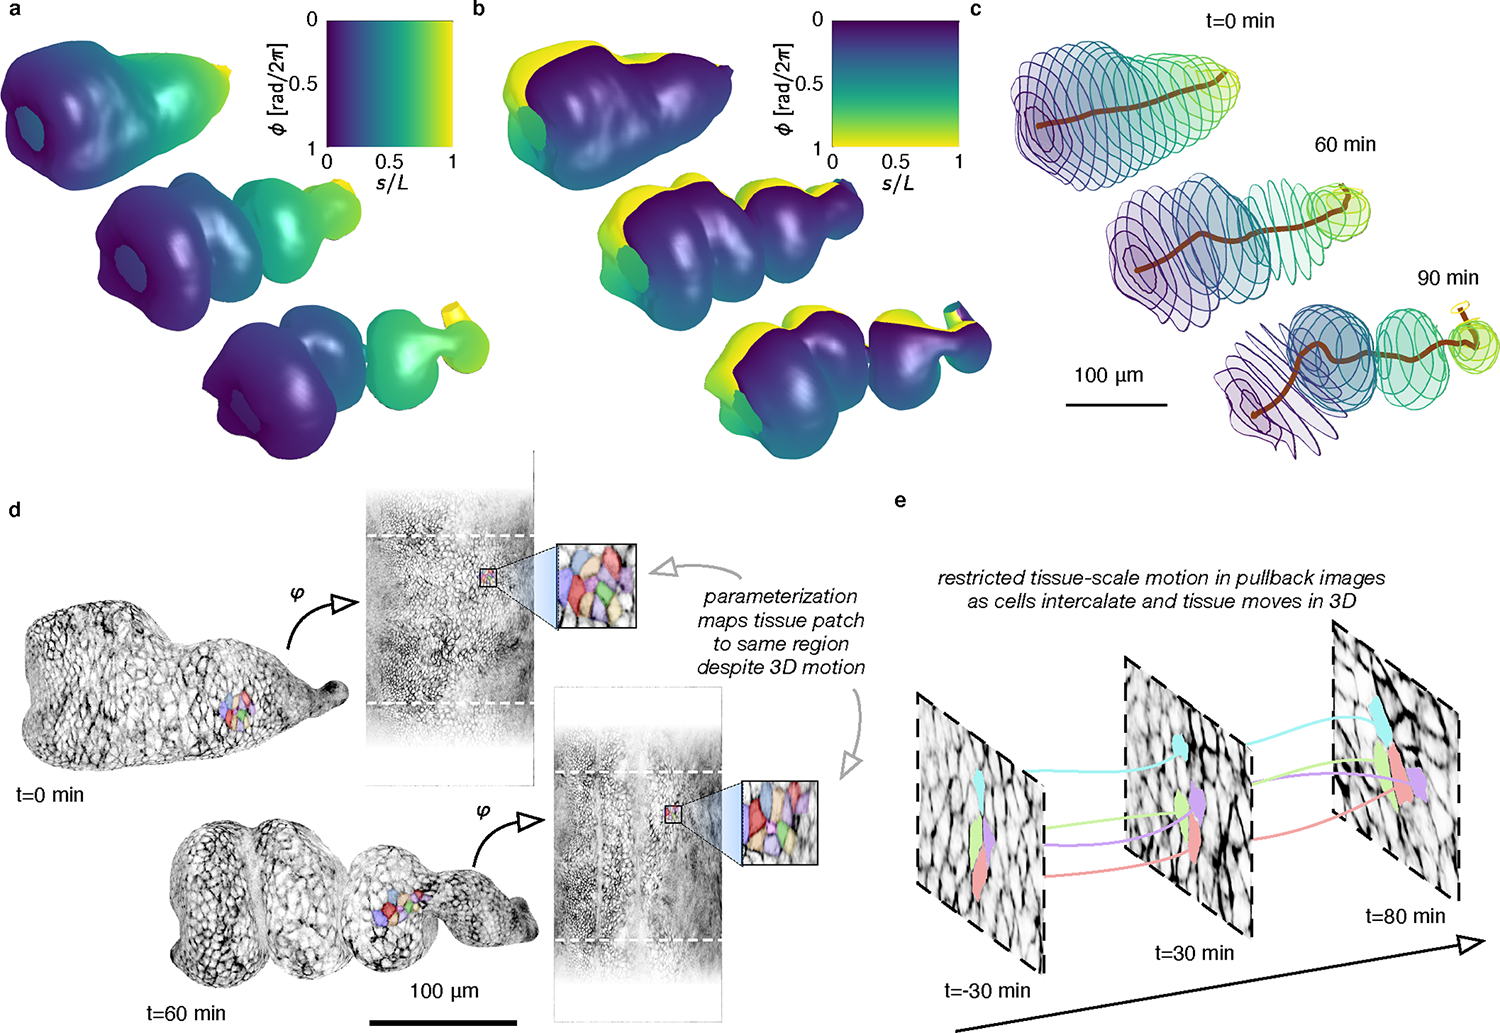
FIG. 2. Coordinate parameterization follows 3D deformations of the evolving surface, enabling quantification of cell and tissue-scale dynamics, shown here for the fly midgut as it folds into compartments.

a-b, Dynamic maps to a fixed material frame captures the midgut’s longitudinal (a) and circumferential (b) coordinates as the surface deforms into a convoluted shape. c, Computational sectioning of the parameterized surface shows circumferential disks of the organ sampled evenly along its length. This construction provides a natural, system-spanning centerline and a measure of sample width along the surface. d, Despite large tissue movement in 3D, tissue motion is restricted in the pullback images, as highlighted by the same patch of cells 1 hour apart. e, While tissue-scale motion is minimized in the pullback images, individual cells may move and exchange neighbors, enabling cell tracking. Measuring the difference between tissue strain-rate and intercalation rate gives insights into the morphogenetic process (see Extended Data Fig. 3).
