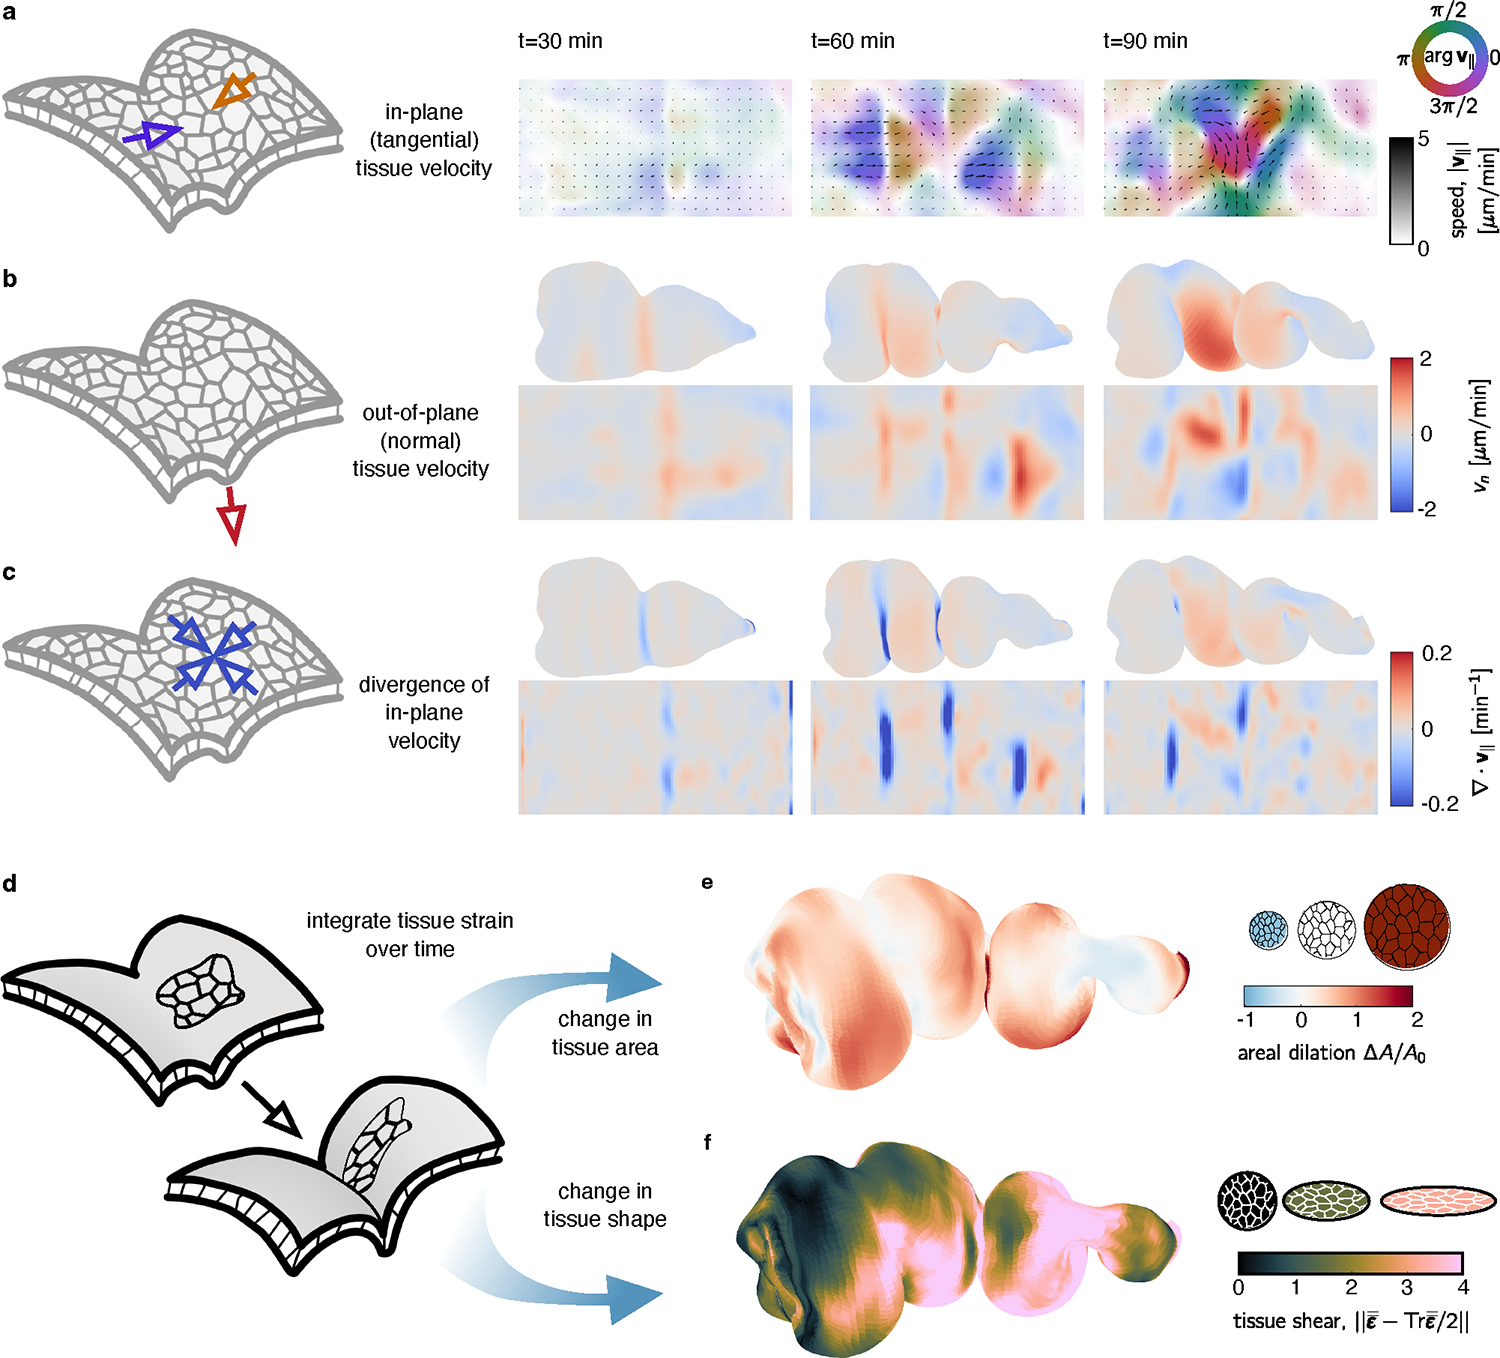
FIG. 3. Dynamic maps to the material frame yield covariant measures of tissue velocity and deformation in 3D.

Tissue velocities are decomposed into in-plane (tangential) and out-of-plane (normal) components. a, 2D pullback representation of in-plane tissue motion shows a line defect near the middle constriction, then defects at the anterior and posterior constrictions, followed by increasingly complex in-plane flows. Color denotes the orientation of flow relative to the longitudinal axis , and the opacity and arrow lengths reflect speed of the tissue motion. b, The underlying out-of-plane velocity is positive (inwards) near constrictions. c, DEC computation of the divergence of the in-plane velocity shows patterns of sinks in the constrictions and sources in the chambers’ lobes, in synchrony with the out-of-plane deformation. d-f Following material pathlines in 3D through time returns measures of integrated strain. These decompose into dilatational (area-changing) and deviatoric (shape-changing) components. e, The dilatational strain shows areal growth in the chambers but less area change near constrictions for a midgut 90 minutes after the onset of the first constriction. f, The deviatoric strain shows strong tissue shear near each constriction at the same timepoint.
