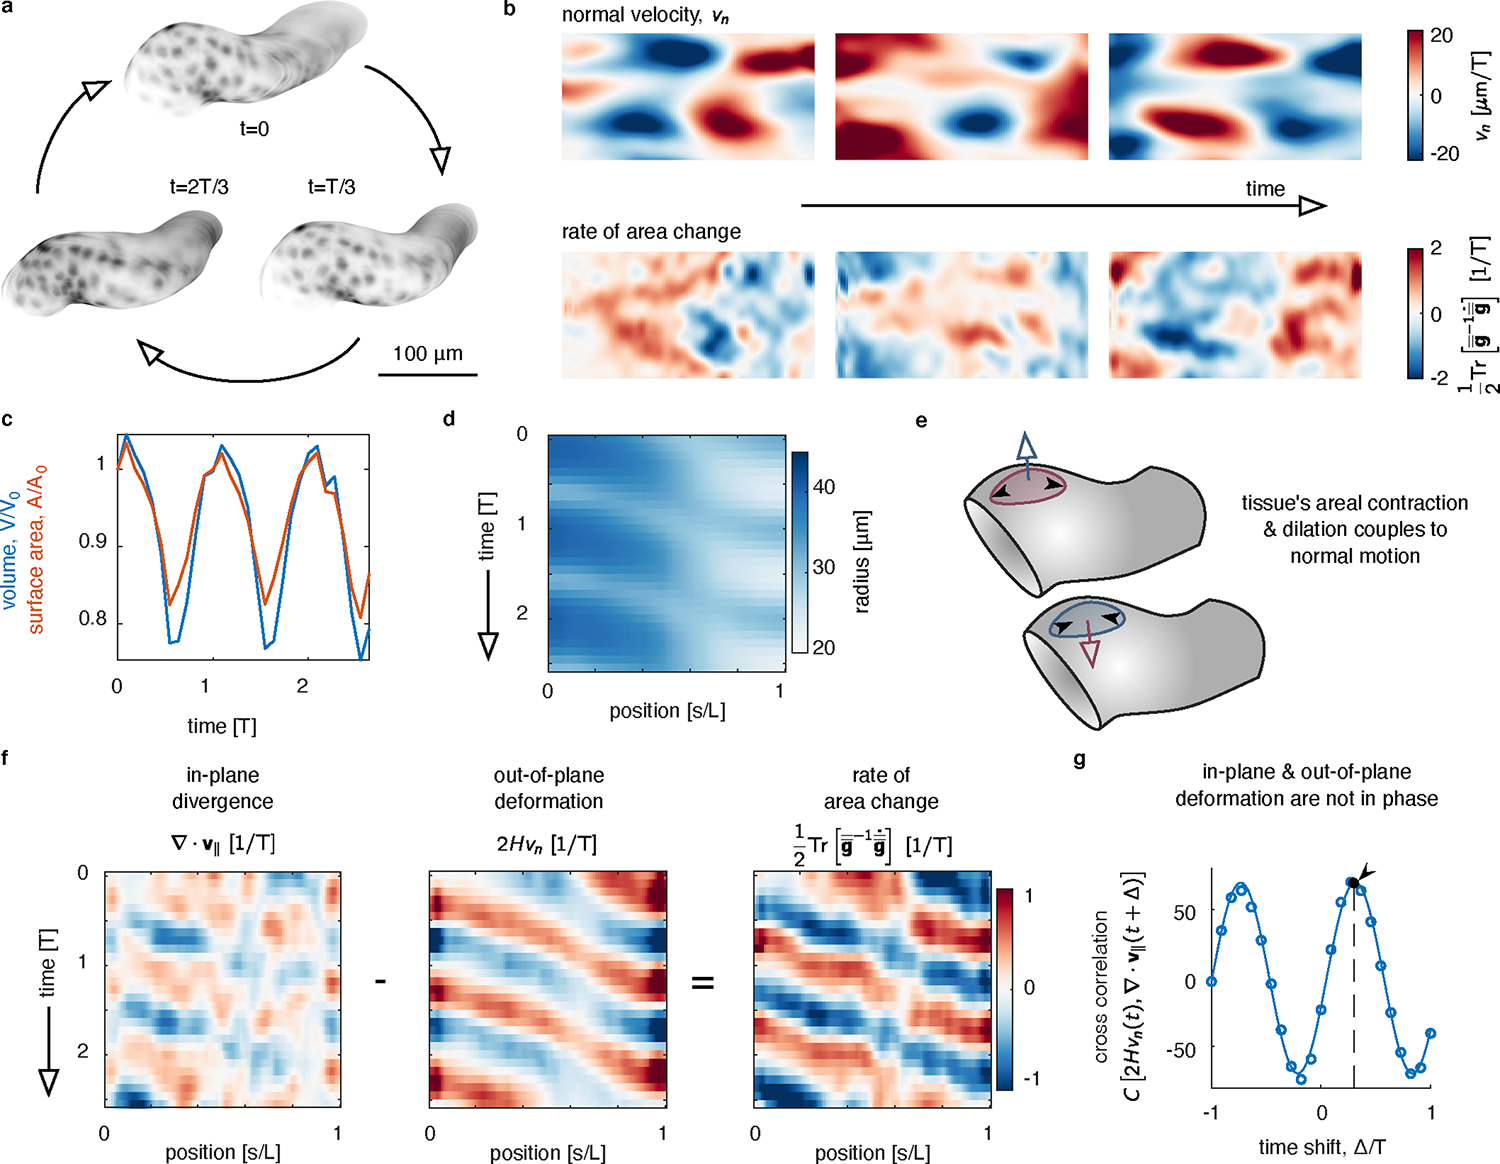
FIG. 4. Tracing the in-plane and out-of-plane dynamics of a beating heart reveals the phased coupling between dilatational and transverse deformations.

a, Segmentation of a beating zebrafish heart shows cyclic deformations in 3D, shown at three timepoints within a beat period, . b, Decomposing in-plane and out-of-plane tissue motion demonstrates how pulsed deformation travels along the long axis of the tube. The normal velocity is represented by a color specifying both its magnitude and the direction, where inward motion corresponds to . c, Both the total enclosed volume and the surface area oscillate over time. d, A kymograph of the radius of the tube measured along the long axis shows cyclic beating. We average the radius around the circumferential axis for each axial position . e, During each cycle, tissue undergoes both out-of-plane motion and in-plane deformation. These two are coupled, such that the rate of area change depends on both the normal motion and the divergence of the in-plane velocity. f, Kymographs of in-plane and out-of-plane motion averaged along the circumferential axis highlights waves of contraction. During each cycle, the in-plane and out-of-plane deformations are nearly out of phase, so that the rate of local tissue area change is large. g, Cross correlation between in-plane tissue dilatation and out-of-plane deformation (constriction of the heart tube) indicates an offset phase relationship. The curve shown is a fit to the data by an offset sinusoidal wave, with a peak fit to .
