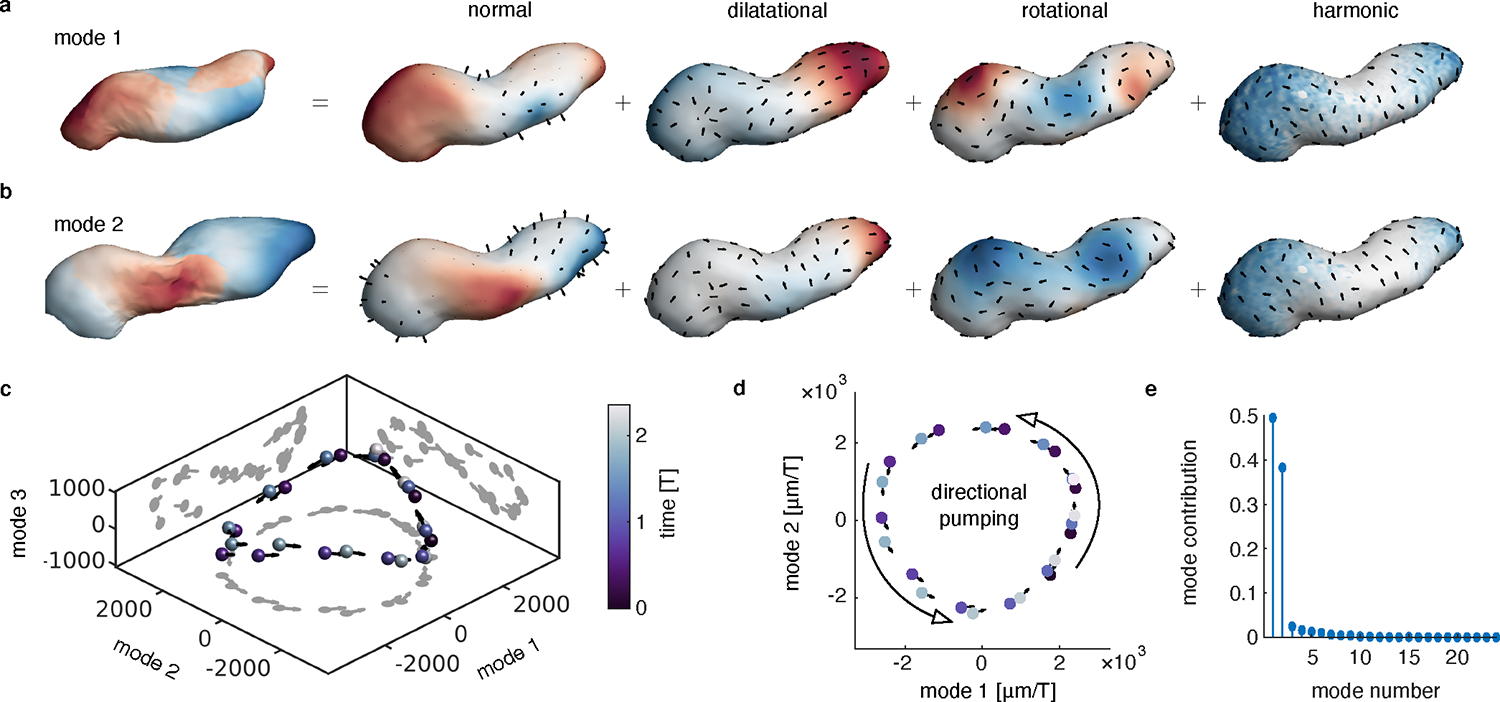
FIG. 5. Decomposition of tissue motion in the beating heart reveals two principal components with nonreciprocal dynamics.

a-b, Visualization of the principal components of Lagrangian tissue velocities. The leftmost image in each panel shows the deformation induced by moving along the associated component axis, colored by the alignment of the component axis with the surface normal direction. Subsequent images illustrate each mode’s normal motion and a Helmholtz-Hodge decomposition of the tangential motion. Color in the normal part represents the norm of the normal component. Color in the dilatational, rotational, and harmonic parts are given by the scalar potential, vector potential, and norm of the harmonic motion, respectively. c, PCA on the time course of deformations returns two dominant modes of deformation. d, The two dominant modes have a phase relationship of nearly , such that the system winds in state space along a nearly planar, circular pattern. e, A comparison of the relative contribution of the first 24 modes shows the time-averaged ratio of the squared length of the projection of the velocity along each mode, normalized by the total squared length of each velocity vector in state space.
