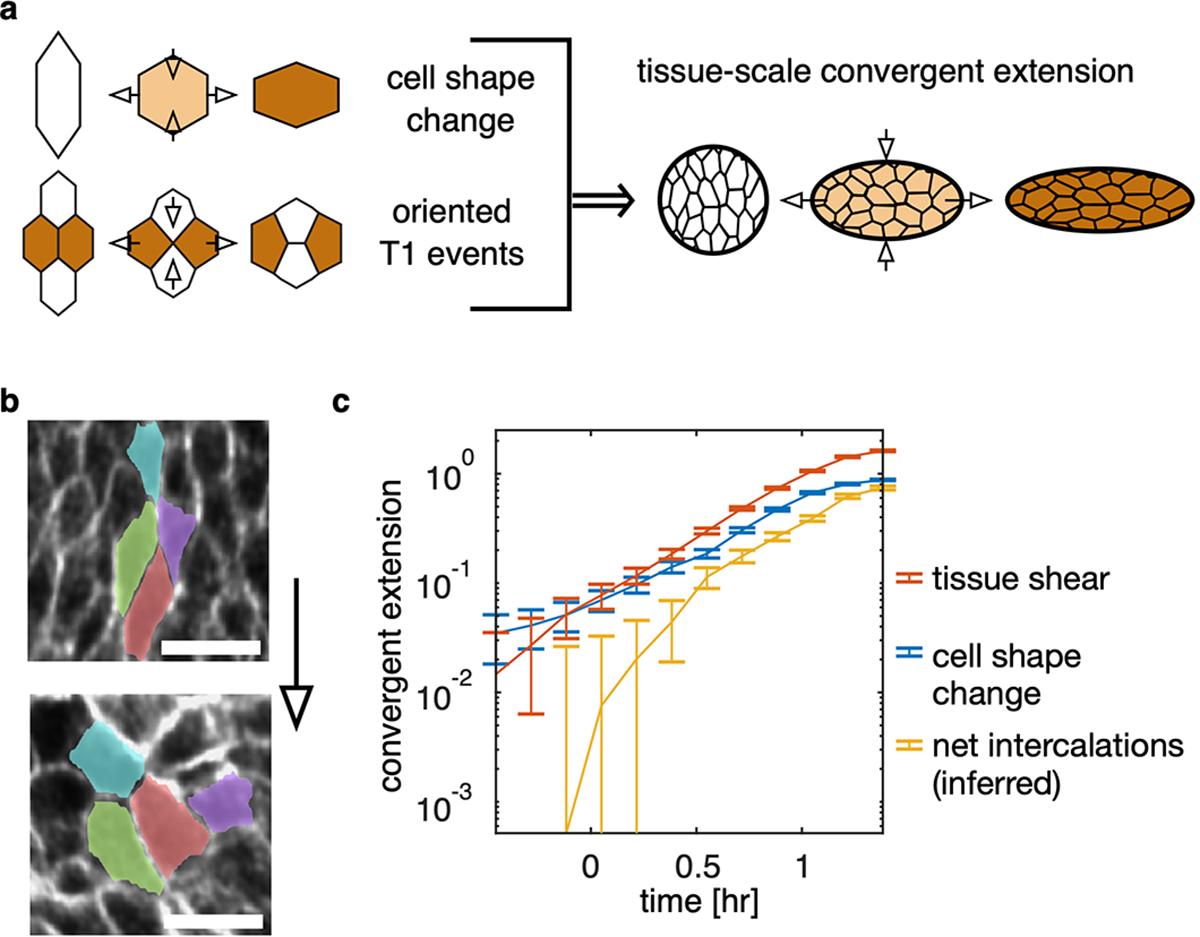
FIG. Extended Data Fig. 3. TubULAR aids in measuring the contribution of cell intercalations to tissue-scale convergent extension.

a, In the absence of cell divisions, in-plane tissue-scale convergent extension occurs due to the changing shape of cells as well as the occurrence of oriented cell intercalations (‘T1 events’). b, During constrictions in the fly midgut, no cell divisions take place, but cells change shape and also intercalate in the endodermal layer. Scale bars are 10 μm. c, We can then compare the cumulative effect of each contribution (blue and yellow) to the total tissue-scale convergent extension (orange, constricting along and extending along ). In the midgut endoderm, we directly measure tissue shear from the deviatoric component of the integrated strain computed from Lagrangian pathlines in 3D. This shear strain is almost entirely oriented along the longitudinal axis . In order to compare directly this quantity to the cell shape change, we imprint the segmentation of 1260 cells at on the tissue surface, follow the outlines of these cells along 3D tissue pathlines obtained from full stabilization with small Gaussian smoothing applied to the optical flow stabilization to avoid self-intersections in pathlines, and compute the cell shape anisotropy in the tangent plane of the tissue for each cell. Here, and are the semimajor and semiminor axes of the ellipse capturing each cell’s moment of inertia tensor, and is the cell’s angle with respect to the material frame’s longitudinal axis. We excluded advected polygons that acquire partial self-intersections from advection, so that we excluded 3, 5, and 8 out of a total 1260 advected cell shapes at the latest timepoints 63, 73, and 83 minutes after constriction onset, respectively. We compared these advected segmentation shapes with the true segmentation. After passing pullback images through a skeletonization procedure detailed in ref. [4], we manually selected , and 964 cells for accuracy with broad organ coverage at each timepoint. Blue and yellow curves represent the net contribution of cell shape change and the net contribution of intercalations averaged across the organ, and the red curve represents the mean tissue shape change. Error bars denote standard error on the mean. Further technical details are found in TubULAR’s generateCellSegmentationPathlines3D method.
