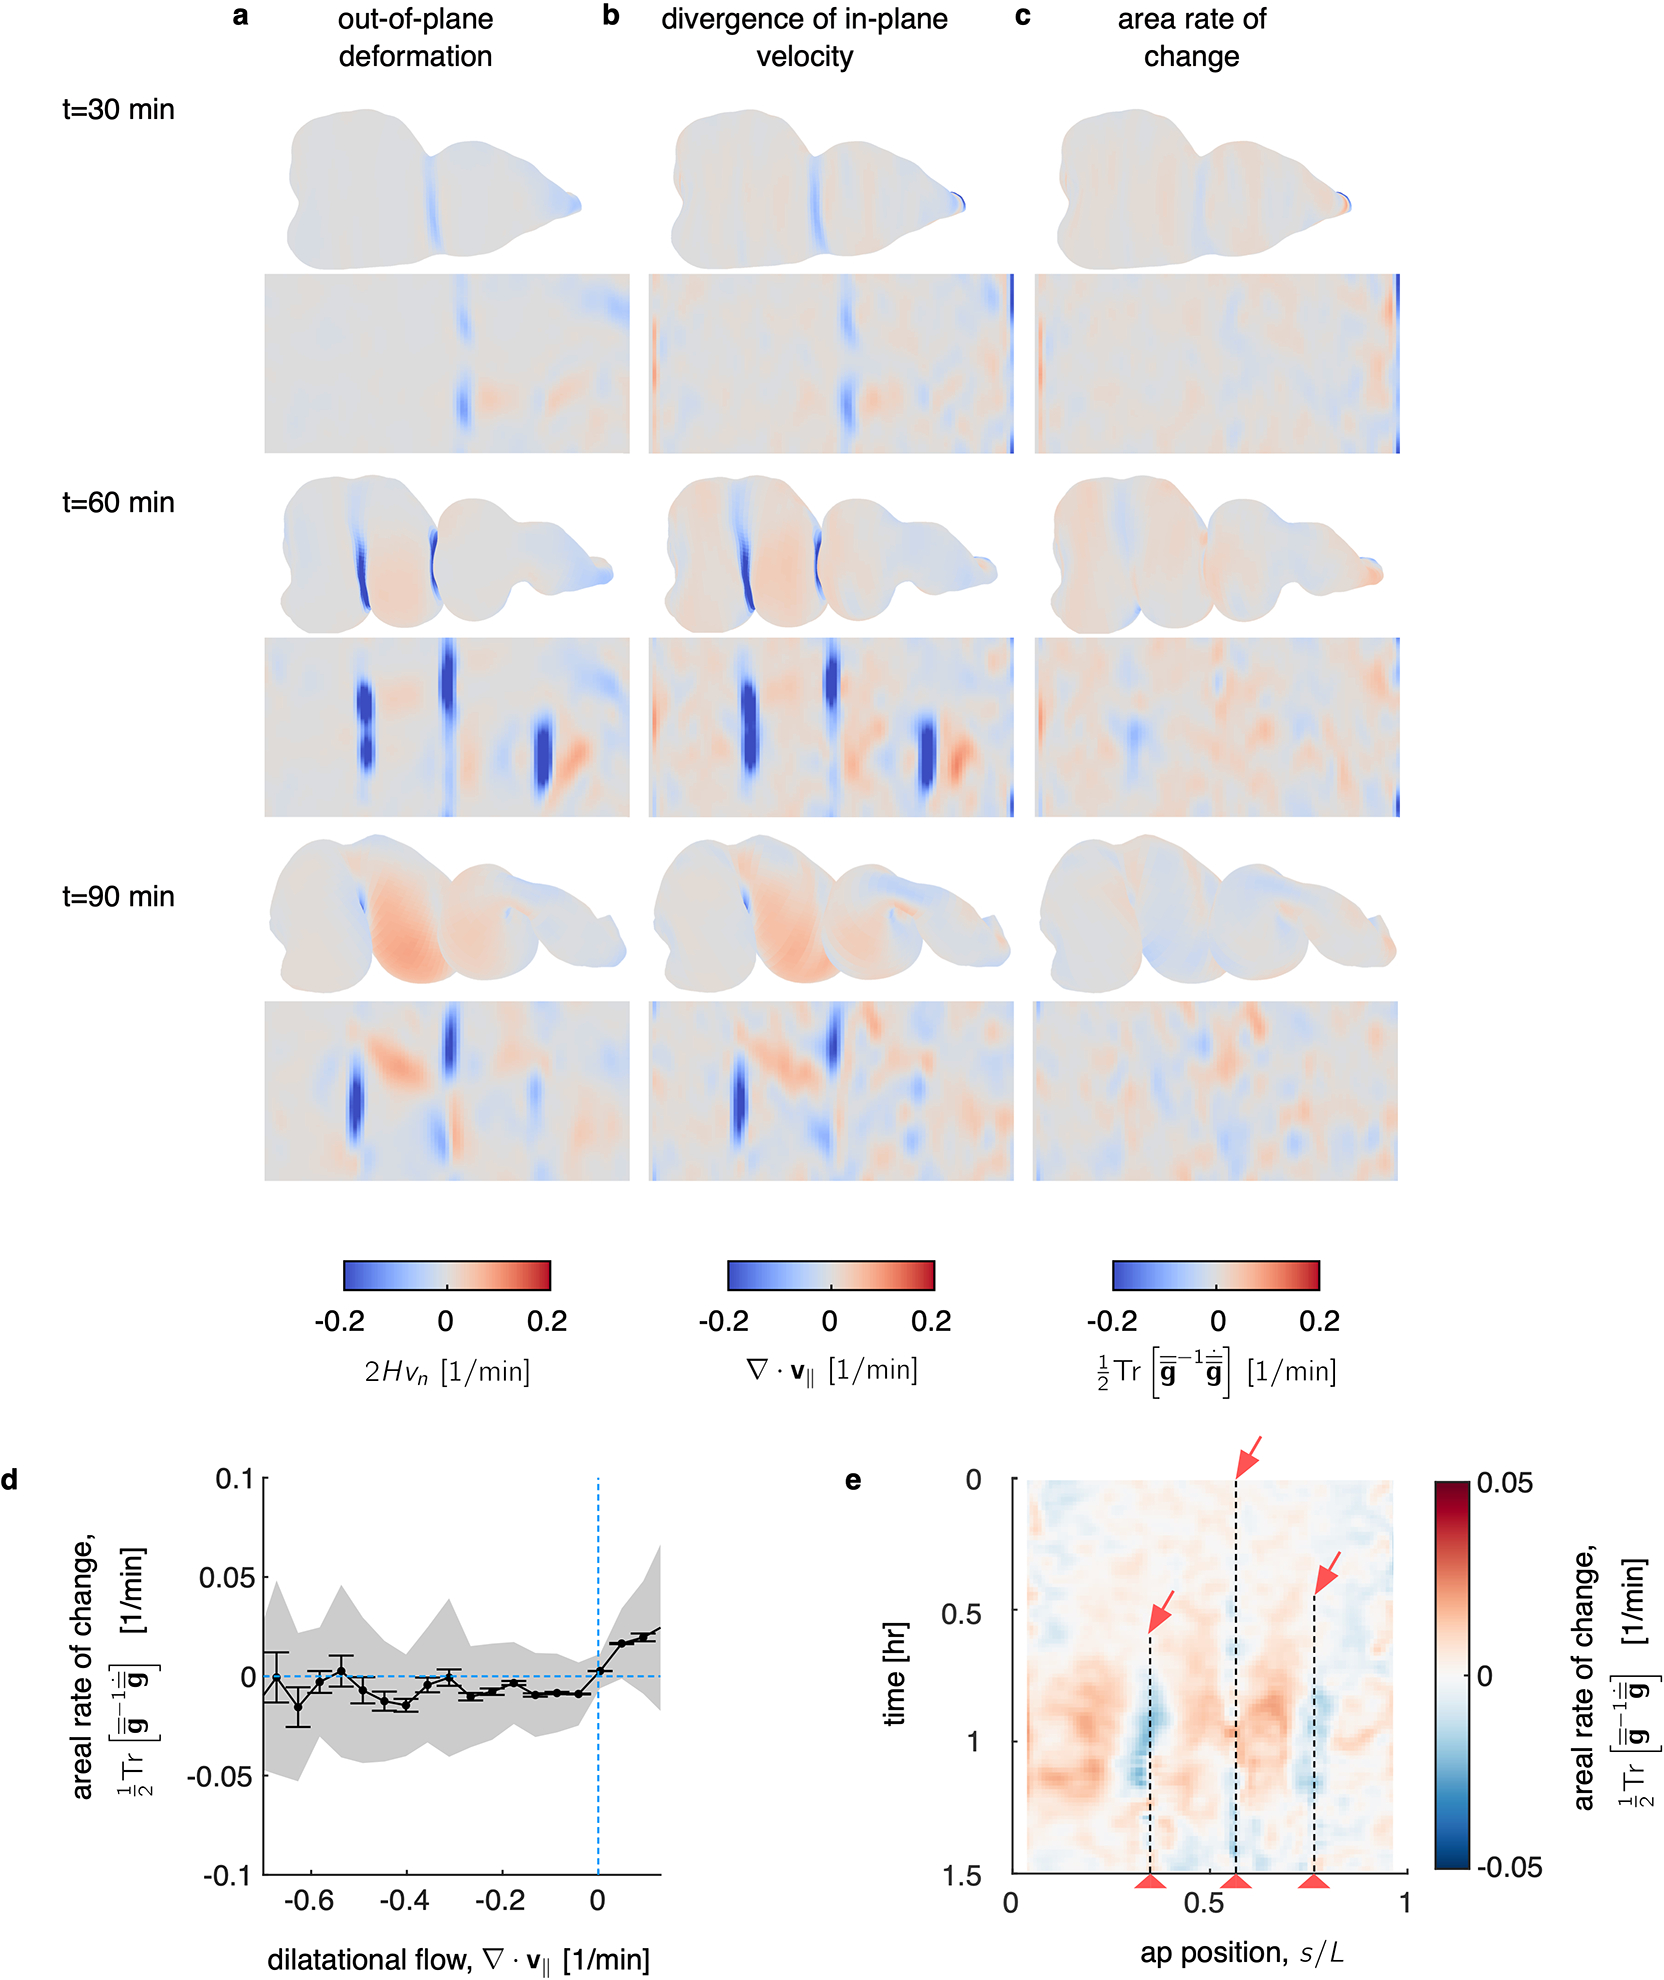
FIG. Extended Data Fig. 4. TubULAR measures the kinematic coupling between in-plane and out-of-plane motion, computing the rate of local area change across the organ, shown here for the developing midgut.

a, The underlying out-of-plane deformation, defined as the normal motion times twice the mean curvature , shows negative values at each constriction, where the mean curvature becomes negative. b, DEC computation of the divergence of the in-plane velocity shows patterns of sinks in the constrictions and sources in the chambers’ lobes, in synchrony with the out-of-plane deformation. c, As a result of the match between in-plane and out-of-plane dynamics, the areal growth rate – defined as – remains relatively quiescent. Here is the metric (first fundamental form) of the tissue surface. d, Regions of tissue which experience positive divergence (the lobes of each gut chamber) tend to experience modest areal growth, while regions with negative tissue divergence experience slight areal compression. This is the relatively quiescent signature of the tissue’s compressibility. Here, data is averaged across three biological repeats, with shaded band denoting standard deviation and tick marks denoting standard error on the mean. e, An example kymograph from a single embryo’s developing midgut showing the small but persistent areal strain rate. The tissue expands in the lobes of each chamber (red in the kymograph) and contracts near each constriction (dashed lines and red arrows). The kymograph is aligned such that each vertical line follows a ring of tissue as it deforms in 3D. In other words, measurements are made in the Lagrangian frame of reference. The anterior-posterior position (horizontal axis) is parameterized in the material frame at the onset of the first constriction.
