
Fig. 4.
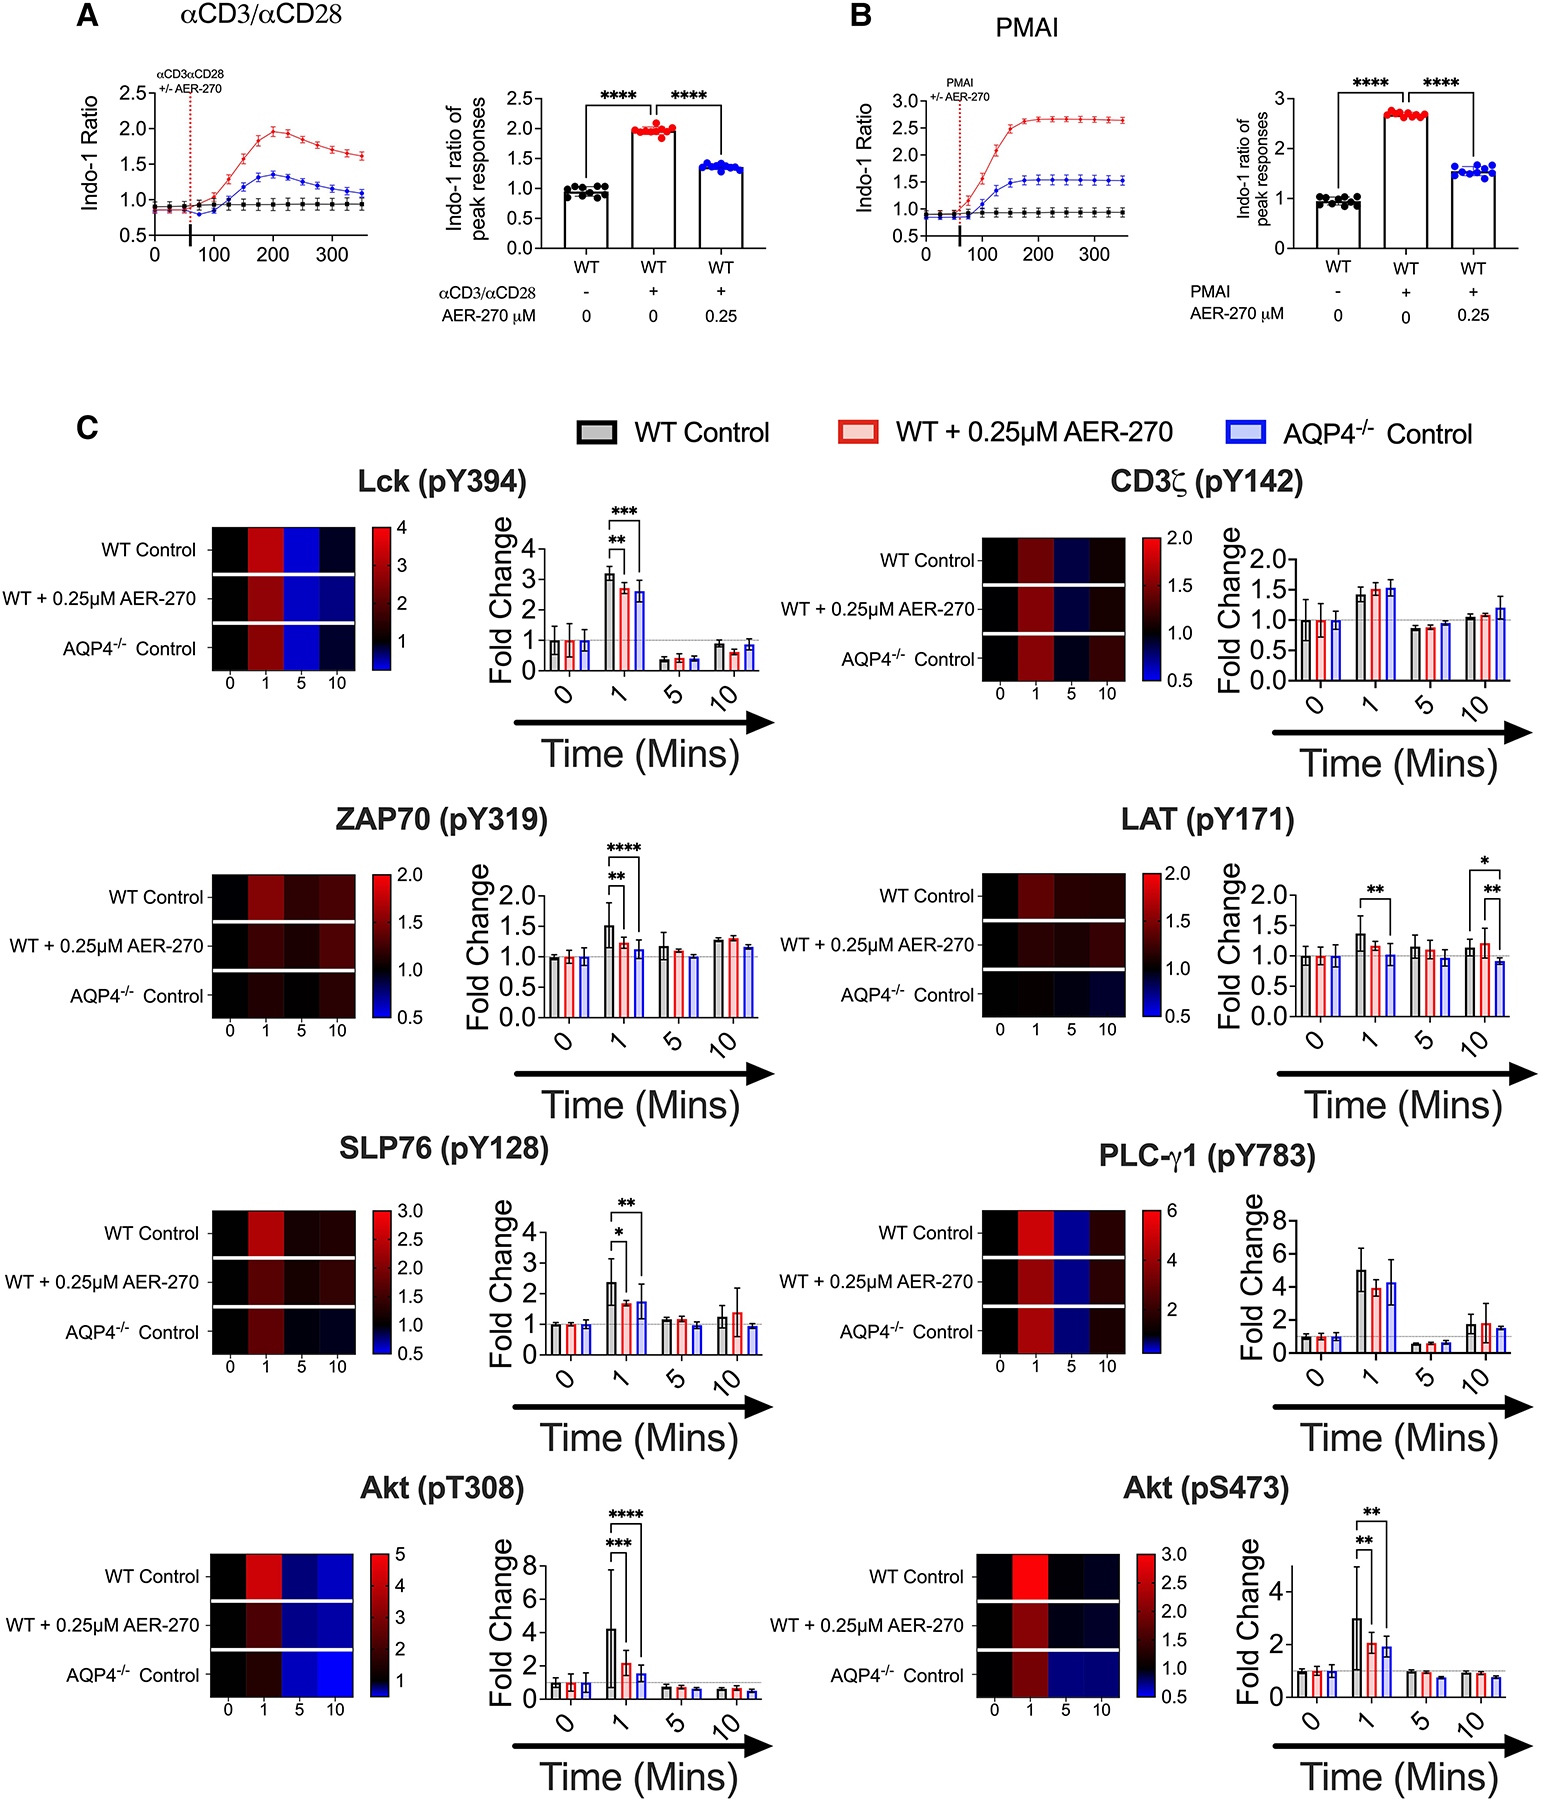
AQP4 is required for optimal TCR-proximal signaling events. (A–B) WT T cells were stimulated with ± 0.25 μM AER-270, and Ca2+ flux following T cell activation was measured as described in the Materials and Methods. Cells were loaded with the calcium sensitive dye Indo-1 AM and a baseline reading was recorded for 60 s (n = 10). After 60 s, cells were stimulated with αCD3/αCD28 mAb (A) or PMA-Ionomycin (B) ± 0.25 μM AER-270 (indicated by dashed line), and the changes in relative calcium-sensitive fluorescence ratios over time were recorded for a further 300 s. Plots show the mean of the maximal calcium peak upon stimulation ± 0.25 μM AER-270. (C) WT T cells were stimulated with ± 0.25 μM AER-270, and phosphorylation of critical signaling events was measured by flow cytometry. T cells from WT and AQP4−/− mice were stimulated with αCD3/αCD28 for 0–10 min ± AER270 and stained for flow cytometric analysis with antibodies against Lck (pY394), CD3ζ (pY142), ZAP70 (pY319), LAT (pY171), SLP76 (pY128), PLC-γ1 (pY783), Akt (pT308), and Akt (pS473) (n = 5–8). gMFI was normalized to 0 s of stimulation for each condition to generate fold increase data visualized as heatmaps and bar graphs. *P < 0.05, **P < 0.01, ***P < 0.001, ****P < 0.0001, and ns—P > 0.05 via a 1-tailed Student’s t-test.