Fig. 1.
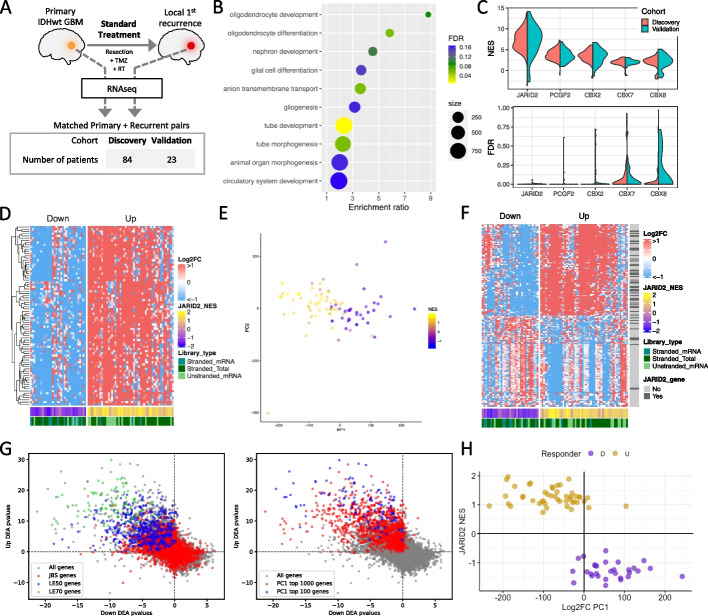
A Schematic of the study design and cohort sizes. These panels visualize data from the Discovery cohort (Validation data is in supplemental figures). B Biological processes enriched in the genes differentially expressed between matched primary and recurrent GBMs. C Per-patient normalized enrichment scores (NES, top plot) and false discovery rates (FDR, bottom plot) for top-scoring promoter-binding factors associated with longitudinal gene expression changes. D Heatmap of the longitudinal fold change in expression for each patient (columns) for the JARID2 binding sites genes (JBSgenes) in the leading edge of > 50% of patients (LE50 genes, rows). Patients separate into Up (NES > 0) and Down (NES < 0) responders irrespective of RNAseq library preparation approach. E Patients are plotted, colored by JBSgenes NES, according to principal components 1 (PC1) and 2 (PC2) of their whole transcriptome longitudinal fold change in expression. F Heatmap of the longitudinal fold change in expression for each patient (columns) for the largest 100 positive and largest 100 negative weighted genes of PC1 from panel E (rows). Whether each gene is a JBSgene is also indicated. G Each gene is plotted according to its -log10p-value result of separate differential expression analyses (DEA) in matched recurrent vs primary tumors in Down (x-axis) and Up (y-axis) responders. Left plot: genes colored according to whether they are JBSgenes or, more specifically, LE50 and LE70 genes. Right plot: genes colored according to whether they are in the top 100 or 1000 genes ranked by the absolute value of PC1 from the analysis in panel E. H Plotting patients according to their JBSgene NES and PC1 score from panel E clearly separates Up and Down responders

