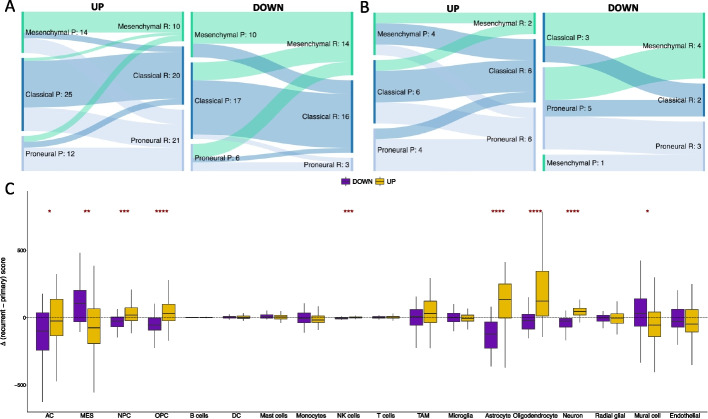
Fig. 2.
A Sankey plots showing the prevalence of subtype switching from primary (P) to recurrent (R) GBM in the Up responders (left) and Down responders (right) in the Discovery cohort. B The same as panel A but for the Validation cohort. C The distributions of change in cell type score, assigned per sample by GBMdeconvoluteR, between primary and matched recurrent GBMs in Down (purple) and Up (gold) responders. The horizonal dotted line indicates no change. The median is denoted by a black horizontal line. Significance is denoted by asterisks: *p < 0.05; **p < 0.01; ***p < 0.001; ****p < 0.0001. Neoplastic GBM cells are on the left of the plot: AC, astrocyte-like; MES, mesenchymal-like; NPC, neural progenitor-like; OPC, oligodendrocyte progenitor-like

