Fig. 5.
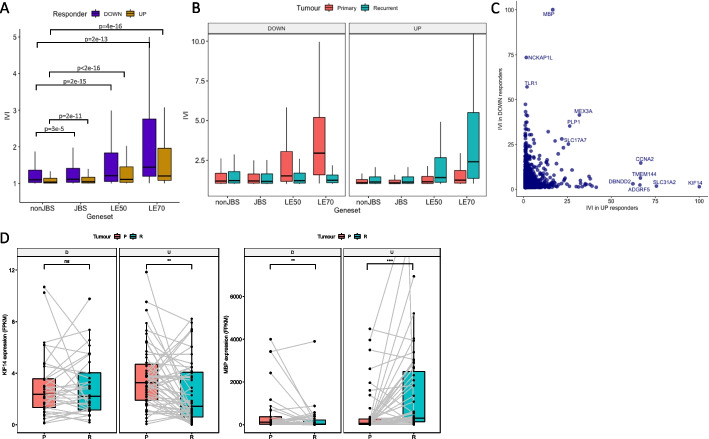
A The distribution of integrated value of influence (IVI) scores for different gene sets, calculated from log2FC (fold change in expression from recurrent to primary) correlation networks, for Down (purple) and Up (gold) responders. nonJBS: genes not in the JARID2 gene set; JBS: genes in the JARID2 gene set but excluding those in the leading edge of at least 50% of patients (LE50 genes); LE50: genes in the LE50 gene set but excluding those in the LE70 gene set; LE70: genes in the leading edge of at least 70% of patients. B As panel A except correlation networks were built from gene expression data in primary (salmon pink) or recurrent (teal) tumors in Down (left panel) or Up (right panel) responders, separately. C Genes are plotted according to their IVI score in log2FC networks of Down (x-axis) and Up (y-axis) responders. Genes that are high in both, or uniquely high in one, log2FC network are labeled. D The expression values for genes encoding Kinesin Family Member 14 (KIF14: left image) and Myelin Basic Protein (MBP: right image) are shown in the primary (salmon pink) and recurrent (teal) tumors of Down (D) and Up (U) responders. Gray lines indicate expression values in primary and recurrent GBMs from the same patient. Significance is denoted: ns, not significant; *p < 0.05; **p < 0.01; ***p < 0.001; ****p < 0.0001

