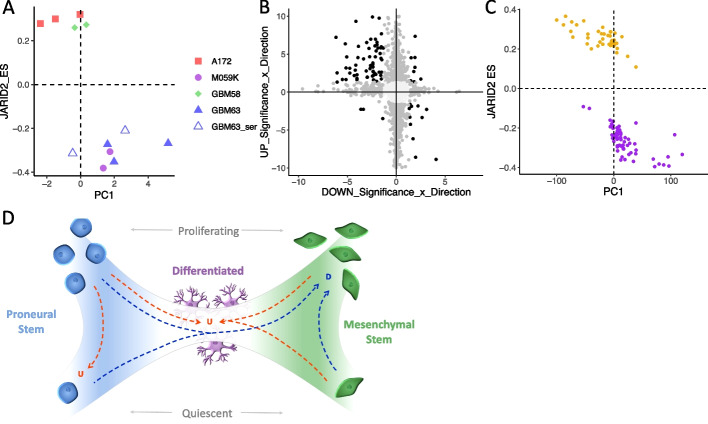
Fig. 7.
A Replicate experiments in GBM cell line spheroids with and without chemoradiation are plotted according to the JARID2 gene set enrichment score (ES) and the value of first principal component (PC1) when results are projected onto the patient principal components in Fig. 1E. B Results of differential expression (DE) analysis between treated and untreated spheroids of Up responder and Down responder cell lines separately (n = 2 or 3). Genes are plotted according to their -log10-adjusted p-value multiplied by the log2fold change (FCp). Colors denote if the gene is significantly DE (FDR < 0.05) in none (light gray), one (dark gray), or both (black) responder subtypes. C Patient GBM samples cultured as organotypic slices and either treated with irradiation and TMZ or left untreated plotted according to the JARID2 gene set ES and PC1 when results are projected onto the patient principal components shown in Fig. 1E. Models are colored according to whether they are Up (gold) or Down (purple) responders. D Our working model to explain GBM responder subtypes: GBM cells are on a phenotypic axis between proneural and mesenchymal stem cells. These stem cells can be in a quiescent or actively cycling state. Differentiated, interconnected (with both each other and surrounding normal cells) cell states lie in the center of the axis. In Down responders, cells in the GBM tumor move towards the mesenchymal phenotype and increase proliferation rates over time. In Up responders, neoplastic GBM cells either become more differentiated and integrate with surrounding cells, upregulating neurotransmitter signaling as they do, or they convert to or remain as proneural stem cells but in a quiescent state over time

