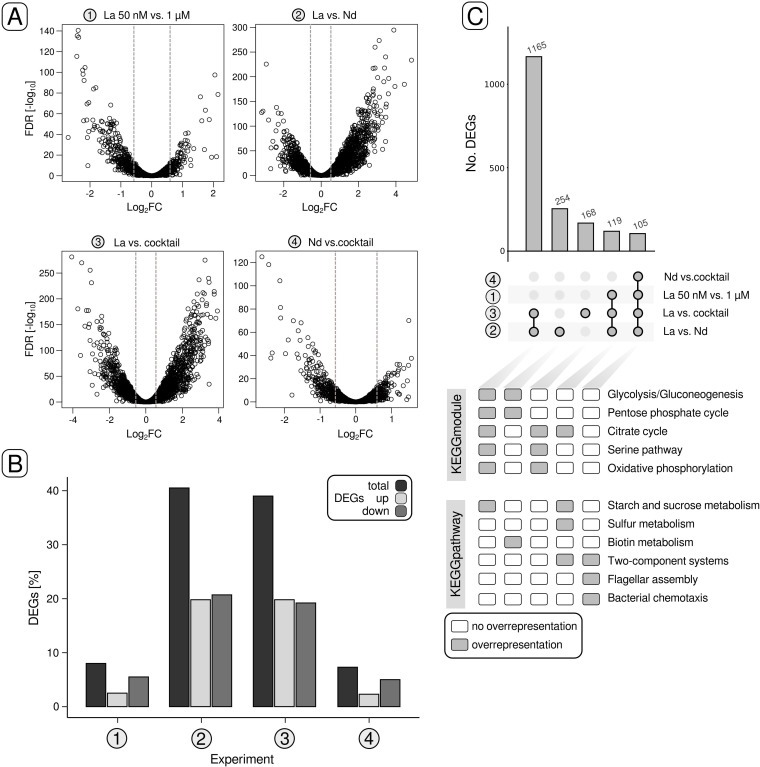
Fig 3.
Differential gene expression in response to La concentration and Ln elements. (A) Volcano plots indicate differentially expressed genes (DEGs) for the four different comparisons 1–4. Genes with changes in gene expression above |0.58| log2FC, gene expression values higher than 4 (log2CPM), and P-values smaller than 0.05 were considered for downstream analysis. The gray dashed lines indicate the log2FC threshold of |0.58|. (B) The proportions of total DEGs, upregulated genes, and downregulated genes in relation to the number of genes encoded in the genome are shown as a bar chart. (C) UpSet plots were used to highlight sets of genes (>100 genes) that were either shared between different comparisons or unique. The lower half of (C) indicates potential overrepresentation of KEGG modules and KEGG pathways. The categories listed under KEGG modules include partially multiple KEGG modules: glycolysis/gluconeogenesis (M00001, M00003), pentose phosphate cycle (M00004), citrate cycle (M00009, M00011, M00173), serine pathway (M00346), and oxidative phosphorylation (M00144). FDR, false discovery rate.

