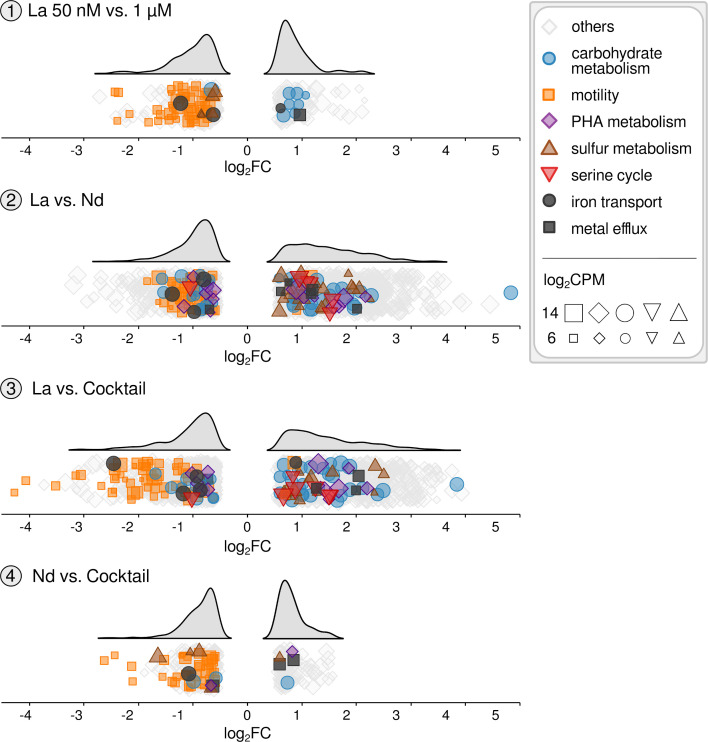
Fig 4.
Differential gene expression relating to selected metabolic aspects in response to different La concentrations and Ln elements. The responsive genes are categorized and listed in Table S11. For each comparison, the up- and downregulation of genes are illustrated through ridge plots based on log2FC values. Marker sizes correspond to the log2CPM values. Selected genes associated with motility, carbohydrate metabolism, PHA metabolism, serine cycle, sulfur metabolism, iron transport, and metal efflux were highlighted. PHA, polyhydroxyalkanoate; log2CPM, log2 counts per million.

