Fig 6.
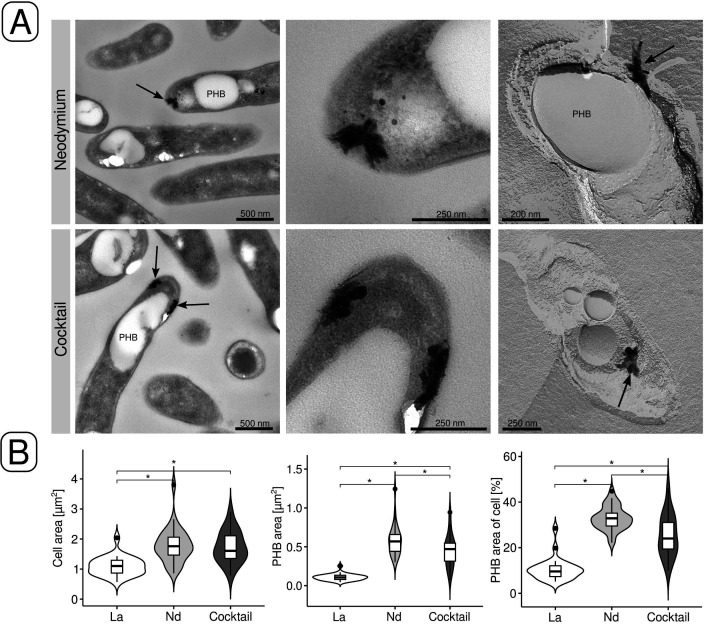
Electron microscopic examination of periplasmic Ln deposits. (A) Deposits were identified and localized by TEM (left panels). The middle panels are close-ups of the areas indicated by black arrows. Periplasmic deposits were also localized and identified by FFTEM (right panels). (B) The size of cells grown with La (30), Nd, or the Ln cocktail was compared by measuring cell areas. We also compared the area occupied by polyhydroxybutyrate (PHB) vacuoles and the area of the cell occupied by them. The analysis was done for three images (magnification, 4,000×; image area, 540.5 µm2), and between 27 and 30 cells were analyzed per condition (La, Nd, cocktail). Statistical significance was tested by means of one-way ANOVA, combined with a post-hoc Tukey-Kramer test. Asterisks indicate significant differences (P ≤ 0.05).

