Figure 3.

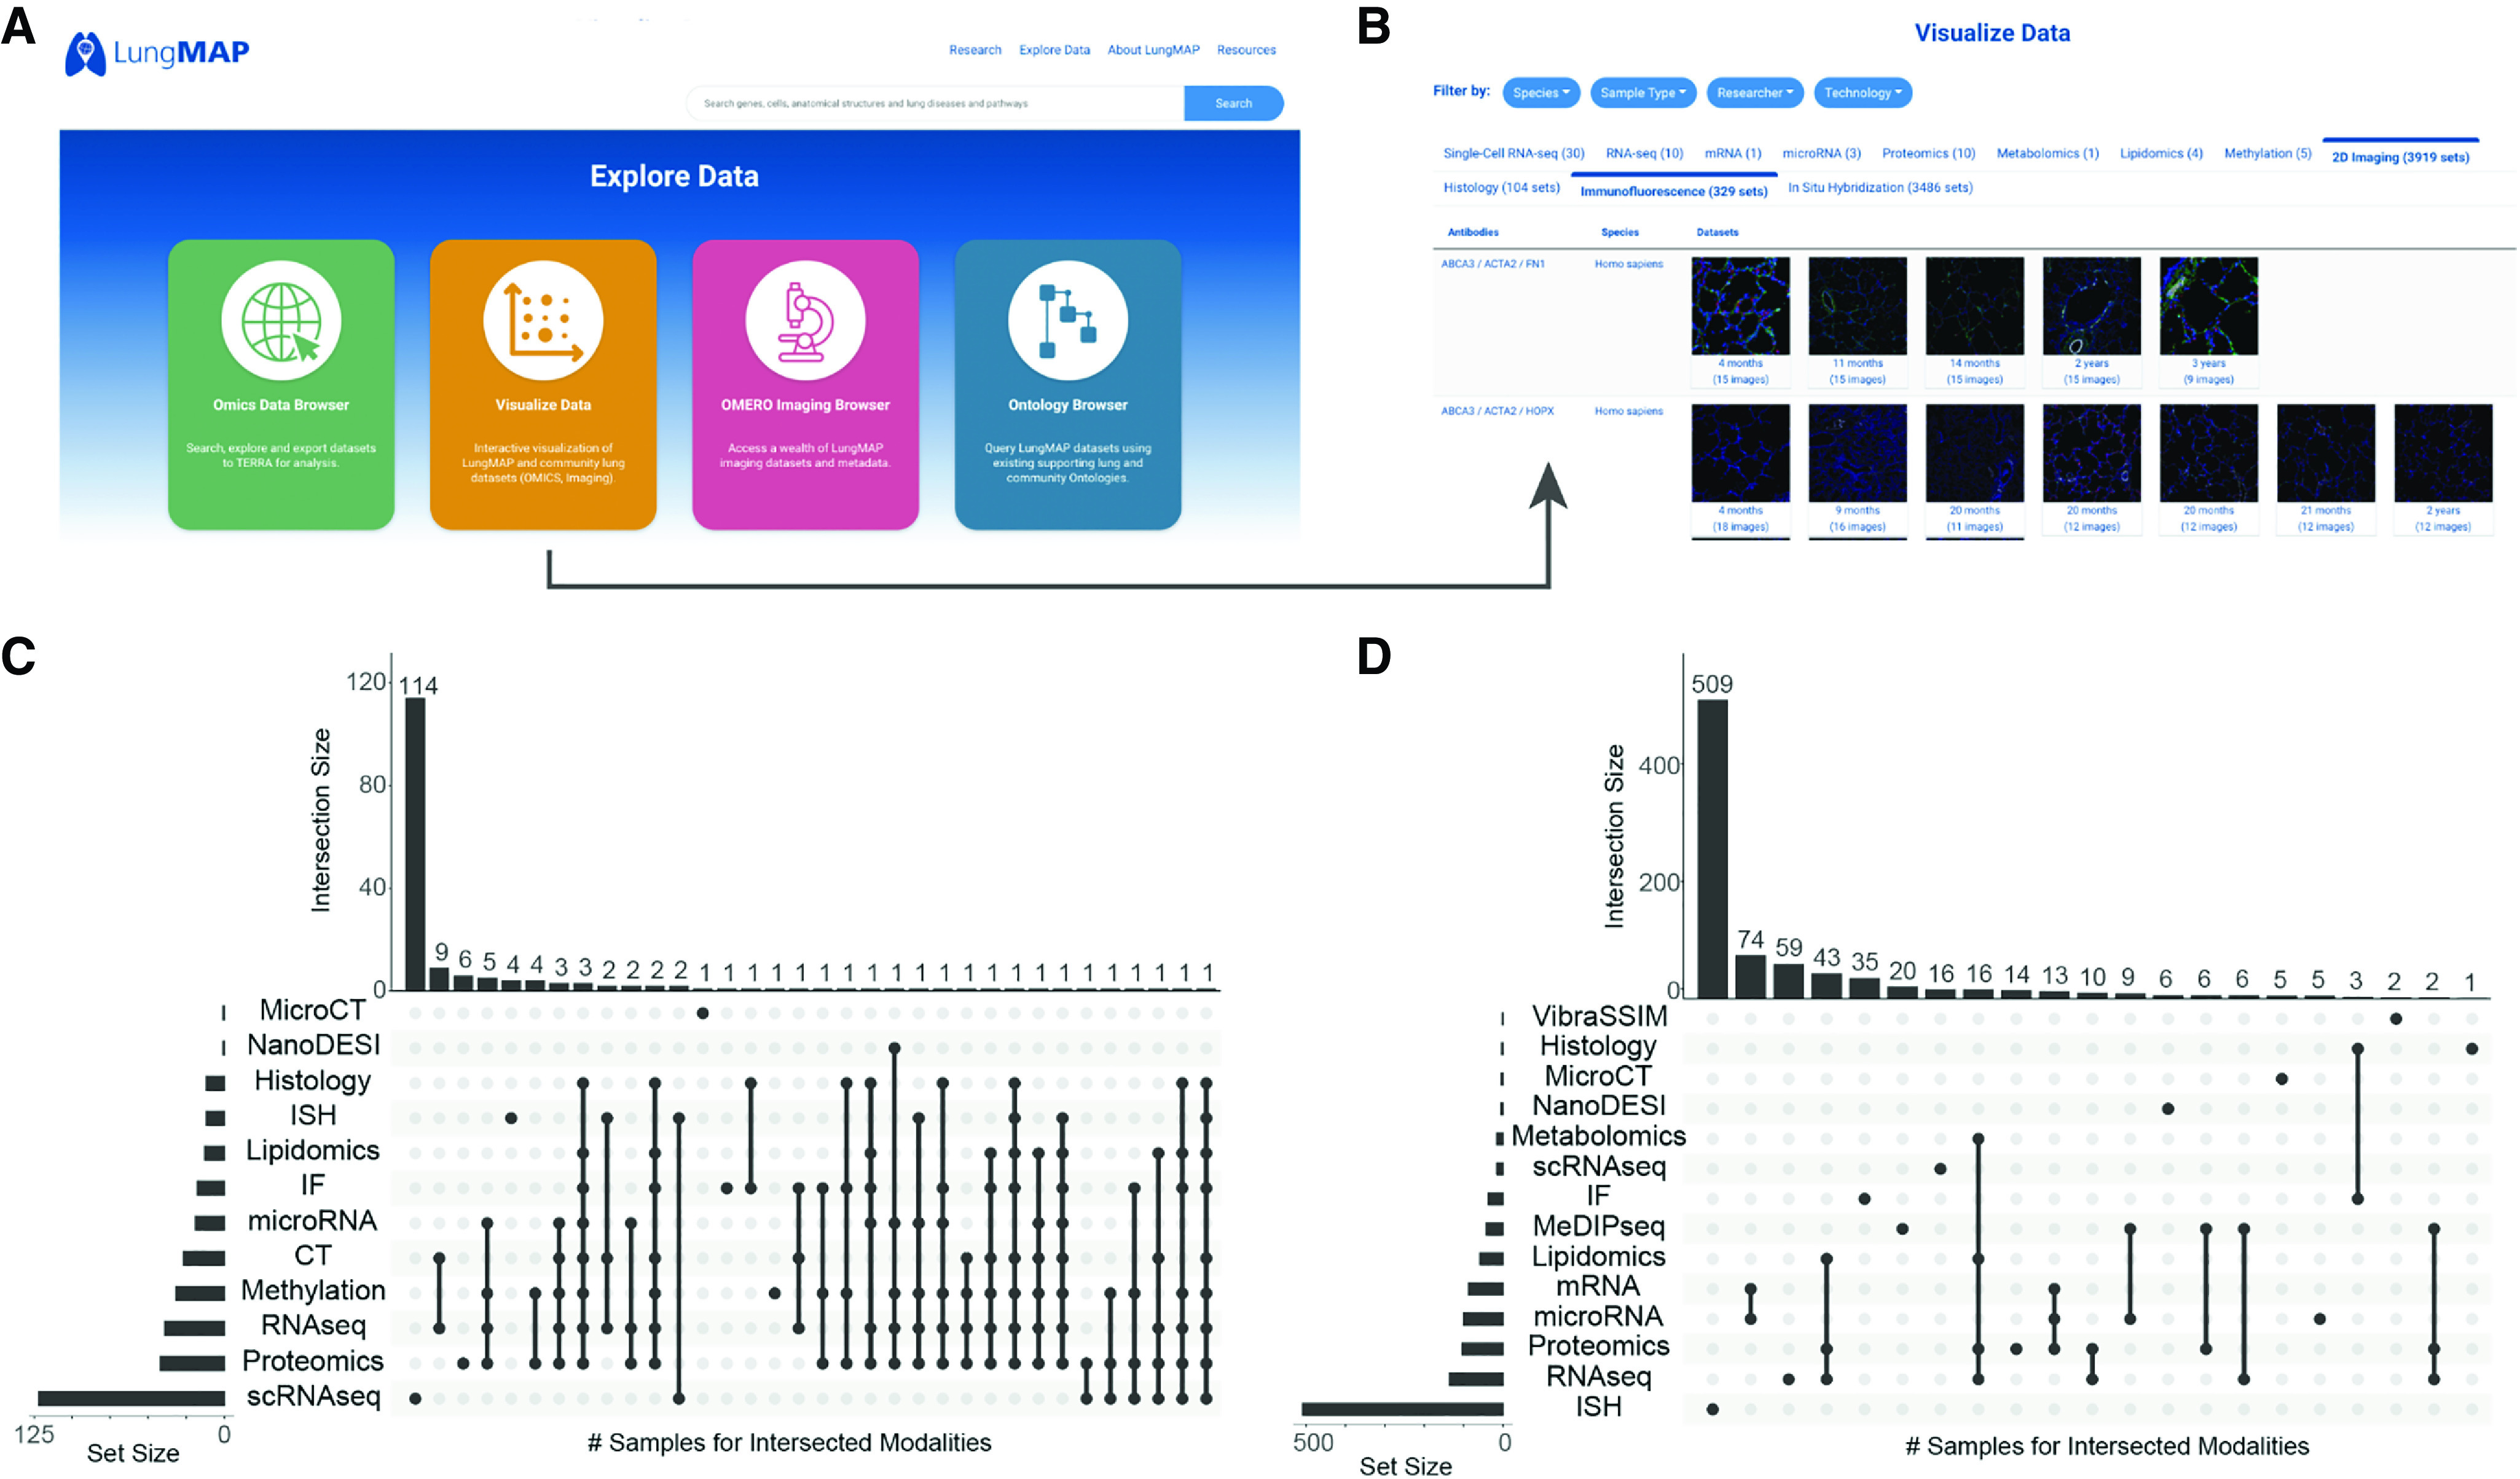
Shared samples across diverse LungMAP molecular and imaging assays. (A) LungMAP.net explore data menu items. (B) Visualize data menu, highlighting immunofluorescence image exploration. (C and D) Upset plot of the intersection of data types available for (C) human donors and (D) mice at LungMAP.net. The x-axis is the graphical intersection of the shared samples across the indicated data types. Many samples often exist for a single donor or sample (e.g., ISH). The set size bar chart provides the number of human donors or mice with each type of data. The intersection size bar chart provides the number of human donors or mice with the intersection of types indicated by dots in the matrix beneath the chart. CT = computed tomography; IF = immunofluorescence; ISH = in situ hybridization; MeDIPseq = Methylated DNA immunoprecipitation sequencing; MicroCT = Microcomputed tomography; NanoDESI = Nanospray desorption electrospray ionization; RNAseq = RNA sequencing; scRNAseq = single-cell RNA sequencing; VibraSSIM = Vibratome serial section imaging microscopy.
