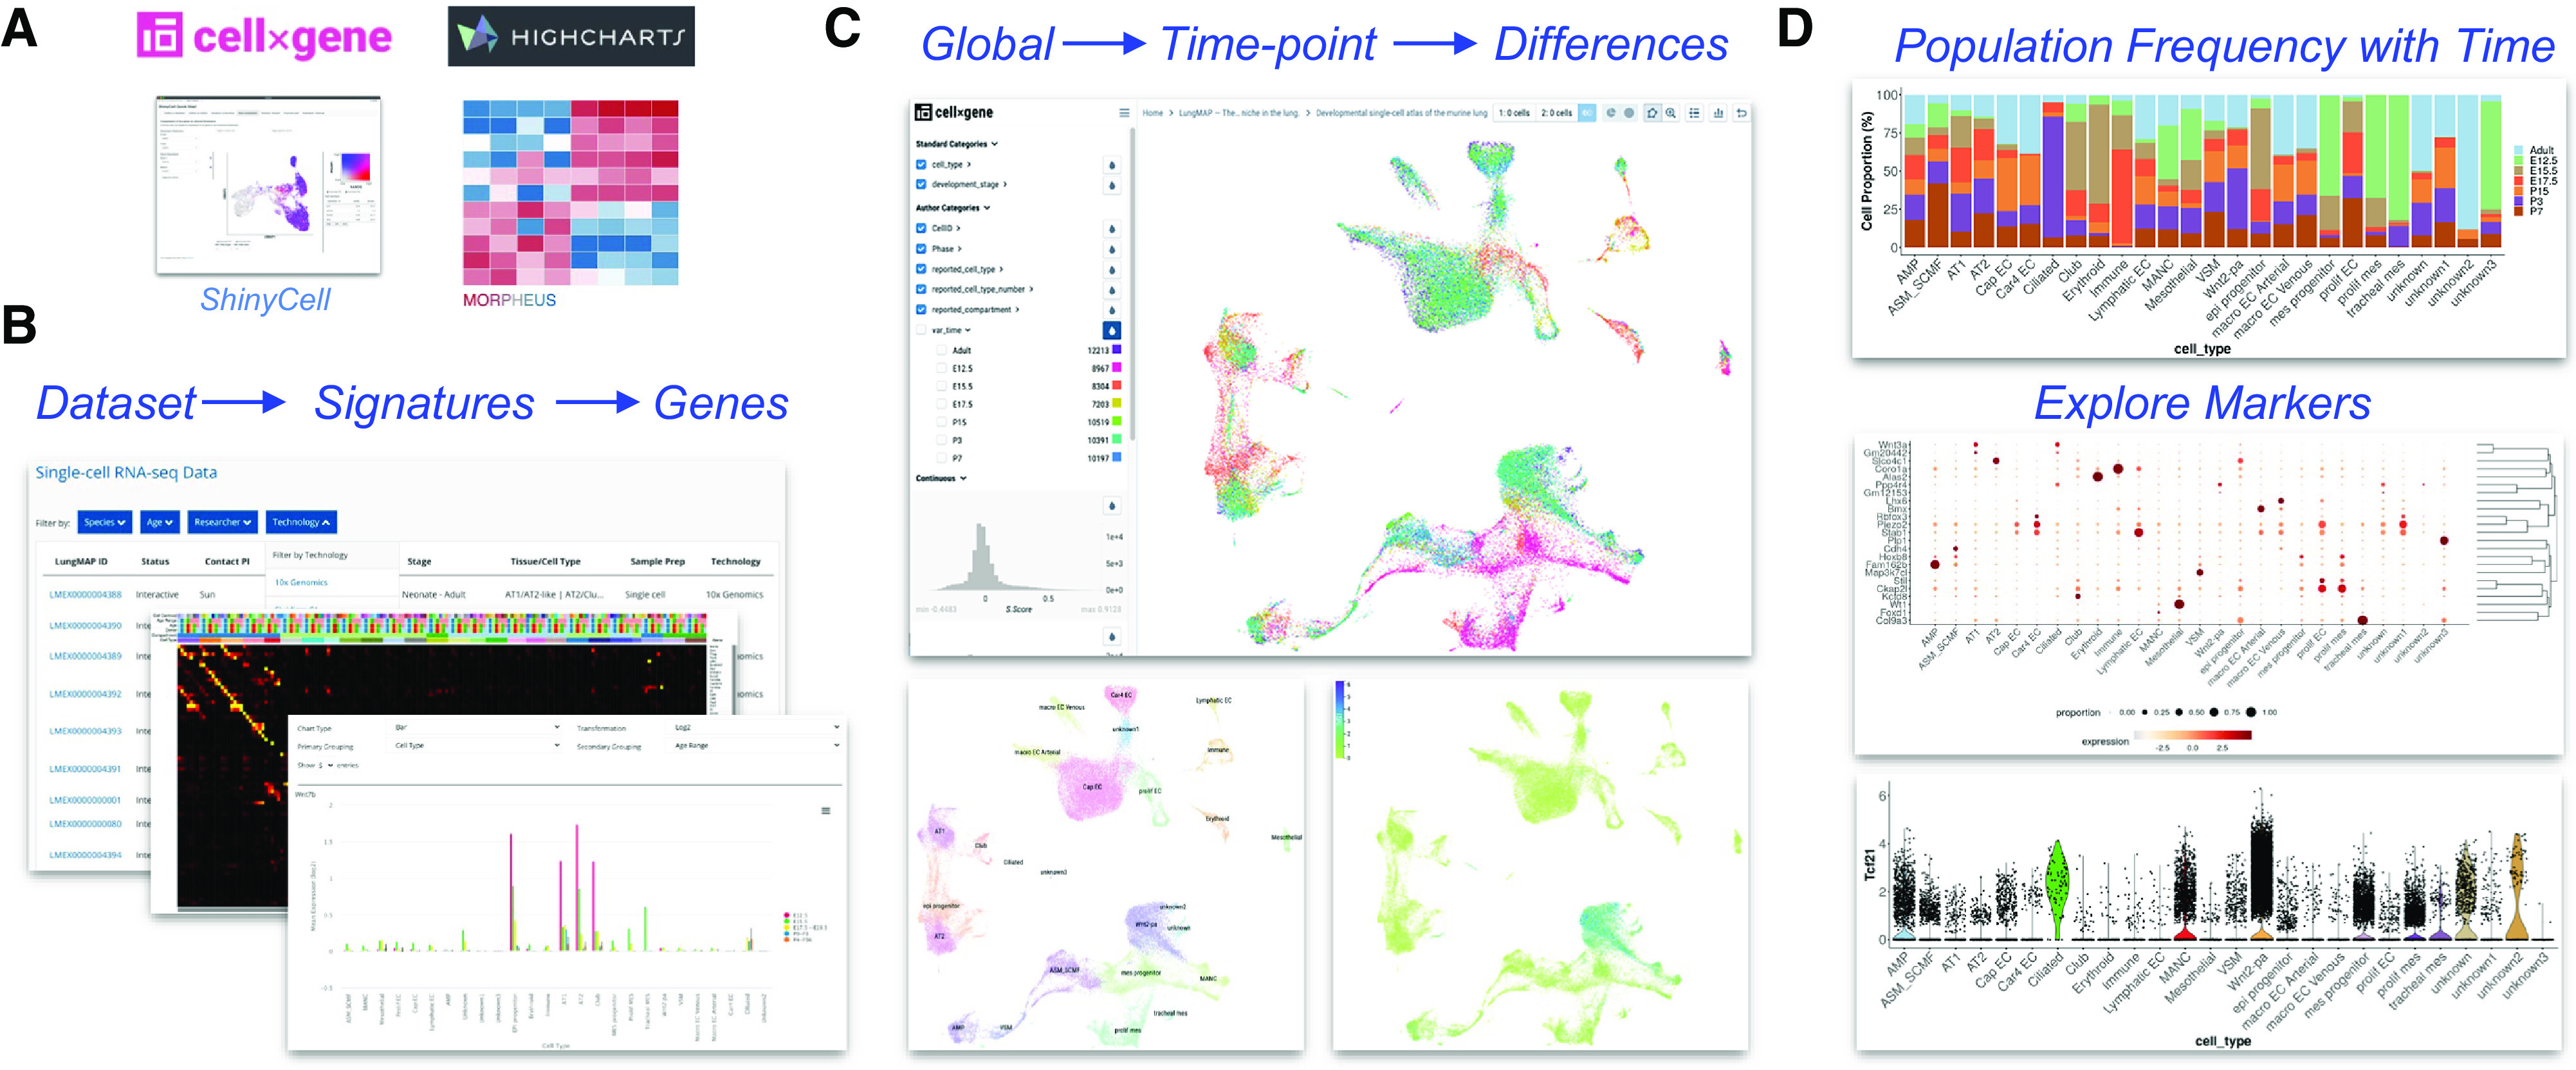
Figure 4.

Comprehensive visualization of single-cell lung atlases. (A) Opensource computational tools for genomics analysis used in LungMAP.net. (B–D) Single-cell atlas of seven time points of mouse development (16). (B) Dataset browsing within the LungMAP.net portal to select datasets by technology, species, or sample age (bottom); Morpheus heatmap browser of available time point and cell-type signatures (middle); HighCharts visualization of gene expression across developmental age. (C) CZI cellxgene dynamic Uniform Manifold Approximation and Projection (UMAP) visualization of integrated developmental time points (top), cell types (bottom left), and gene expression for prior defined candidates or cellxgene time-point differential expression-identified genes. (D) R ShinyCell browser plots for cell-type frequency at different developmental time points (top), proportion bubble plot for selected genes (middle), and violin plot of expression for a selected gene (bottom).
