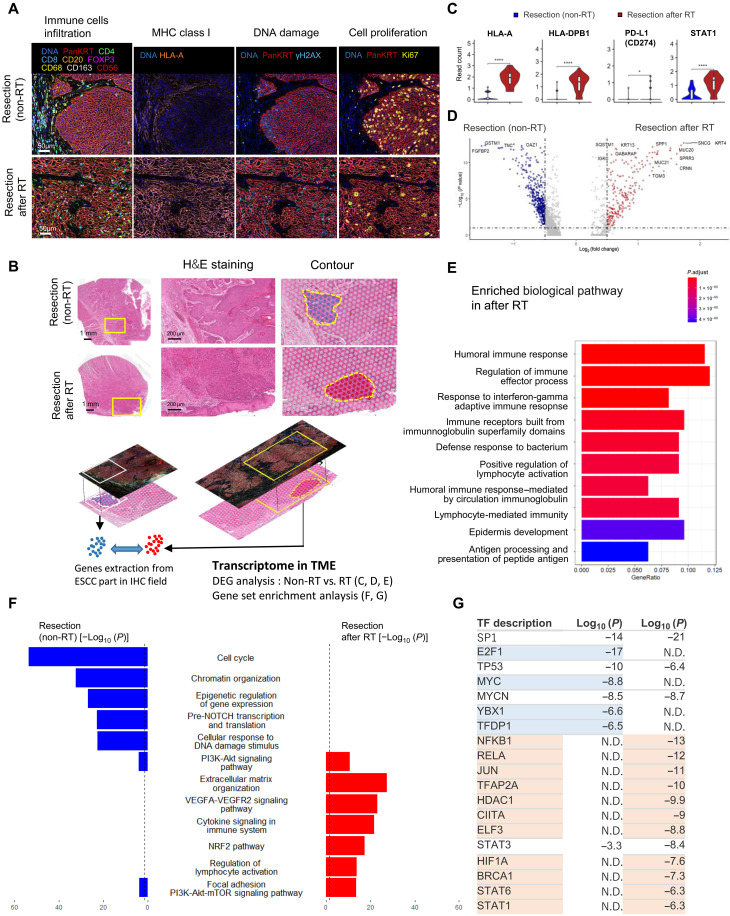
Fig. 2. Characterization of gene expression profiles in the tumor microenvironment (TME) of esophageal squamous cell carcinoma (ESCC) after radiotherapy.
(A) Identification of the microenvironment surrounding ESCCs after radiotherapy (RT). Multicolor immunohistochemistry (IHC) staining showed immune cell infiltration, major histocompatibility complex (MHC) class I expression [human leukocyte antigen A (HLA-A)], DNA damage (γH2AX), and cell proliferation (Ki67). (B) Workflow of integrated spatial analysis. The TME was identified by IHC, and TME transcriptome data were extracted from the IHC-merged field in VISIUM. H&E, hematoxylin and eosin. (C) Gene expression of MHC class I (HLA-A), MHC class II (HLA-DPB1), PD-L1 (CD274), and STAT1 according to 10x VISIUM (****P < 1 × 10⁻¹⁶, *P < 0.05, Bonferroni-adjusted Wilcoxon test; ns, no significance). Figure S5A shows gene expression in the total and IHC fields. (D) Differentially expressed gene (DEG) analysis between the Re and RT groups. Volcano plot showing gene expression in each contoured field in Fig. 2B. (E) Gene enrichment analysis showed up-regulated biological pathways in the viable ESCC field after RT. (F) Pathways enriched in non-RT and after RT tissue (adjusted P < 0.01). (G) Transcription factors that were significantly enriched in non-RT and post-RT tissues (P < 1 × 10⁻⁶).

