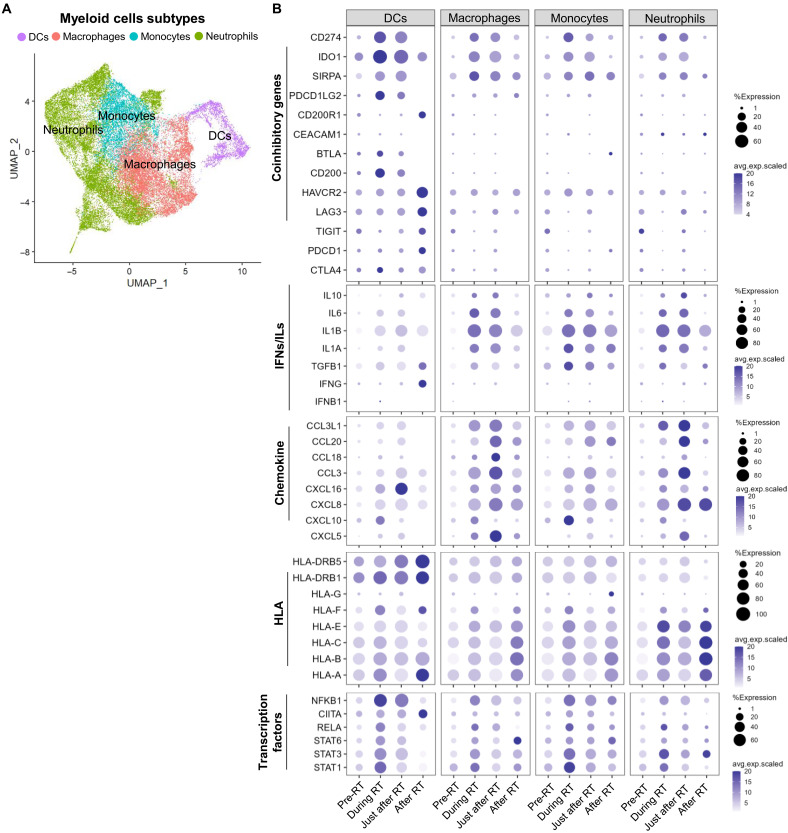
Fig. 4. Characterization of the immune response gene expression profile in myeloid cells with time after radiotherapy.
(A) Uniform Manifold Approximation (UMAP) of subclusters in the myeloid cell cluster. (B) Bubble charts of the percentage of cells within the indicated myeloid cell subclusters that express immune coinhibitory, interleukin (IL) and interferon (IFN), chemokine, and human leukocyte antigen (HLA) genes and the corresponding average gene expression level. A larger dot indicates a higher percentage of cells expressing a particular gene; a darker color dot indicates a higher average gene expression level. DCs, dendritic cells.

