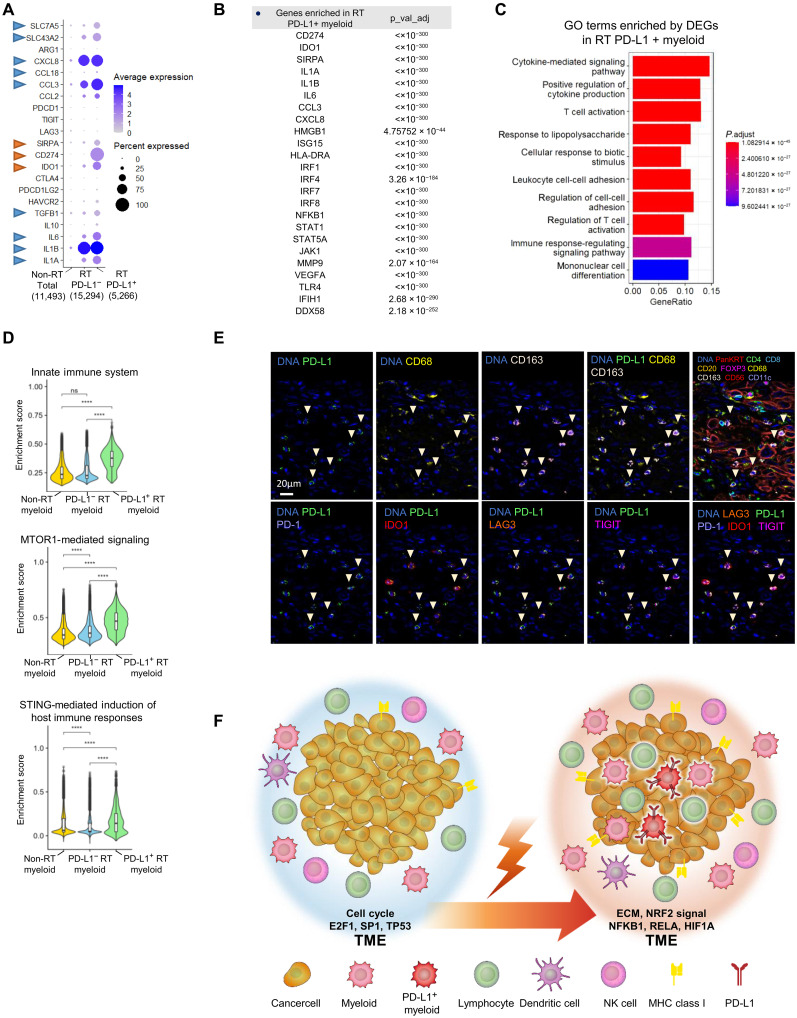
Fig. 5. Identification of PD-L1–positive myeloid cells showing high expression of multiple immune-inhibitory genes after radiotherapy.
(A) Gene expression signature of myeloid cells from non-radiotherapy (RT) and post-RT patients. Myeloid cells from patients after RT were classified as PD-L1–negative or PD-L1–positive. Bubble charts of total myeloid cells and non-RT (1,1493 cells), PD-L1–negative (15,294 cells), and PD-L1–positive (5,266 cells) myeloid cells after RT; PD-L1–positive myeloid cells showed high expression of immune checkpoint inhibitor (ICI) target genes (red arrowhead) and other protumor genes (blue arrowhead). (B) Differentially expressed genes (DEGs) between non-RT total myeloid cells and PD-L1–positive myeloid cells after RT. DEGs were defined by P < 0.05 (Bonferroni-adjusted Wilcoxon test) and fold change > 2. (C and D) GSEA of DEGs in PD-L1–positive myeloid cells after RT and total myeloid cells. (****P < 1 × 10⁻¹⁶, Bonferroni-adjusted Wilcoxon test; ns, no significance). (E) Identification of PD-L1–expressing cells after RT by multicolor immunohistochemistry (IHC) staining. In addition to PD-L1, the upper line shows CD68, CD163, PanKRT, CD4, CD8, CD20, FOXP3, CD56, and CD11c expression for cell orientation. The lower line shows the ICI target genes PD-1, IDO1, LAG3, and TIGIT. Figures S7 and S8 show the low-power field for each antibody staining experiment. (F) Graphical summary of tumor microenvironment (TME) alterations after RT in esophageal squamous cell carcinoma (ESCC) tissue.

