Fig 1.
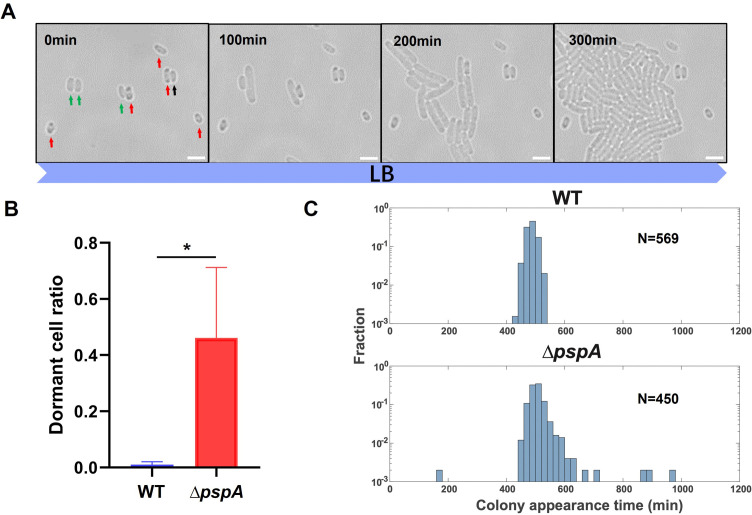
Deletion of pspA caused an increased dormant cell ratio and prolonged lag times. (A) The growth of E. coli ∆pspA strain from the middle stationary phase was recorded under a bright-field microscope at 37°C in LB medium. The different colors of arrows represented different cell fates during recording for 5 h. Green: active cells; Red: dormant cells; and Black: dead cells. (B) The dormant cell ratio of wild type and ∆pspA calculated from time-lapse imaging. The dormant cells were defined as non-proliferating and viable cells for 5 h in fresh LB medium during imaging process. (C) Lag time distribution of wild type and ∆pspA from the middle stationary phase was determined using ScanLag. The X axis represents the colony appearance time of samples on LB agar plates in a ScanLag setup at 37°C. N indicates the cell number measured. Scale bar, 3 µm. Each data bar in (B) indicates the mean ± standard deviation of at least three independent experiments. The significance of the two data bars, indicated by a line and asterisk spanning above them, was analyzed via two-tailed Student’s t test. *, P < 0.05; **, P < 0.01; ***, P < 0.005.

