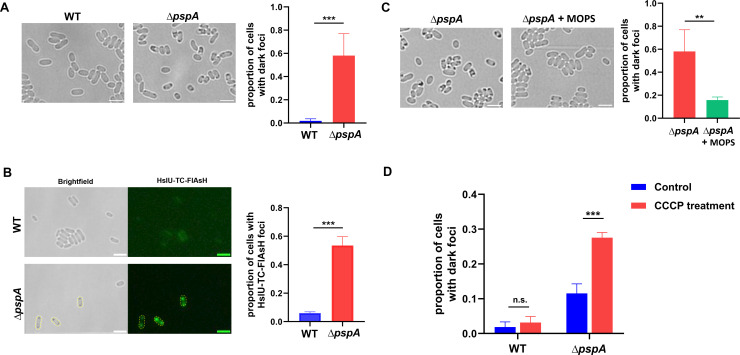
Fig 3.
Lack of pspA accelerated intracellular protein aggresome formation during stationary phase. (A) Bright-field images of wild type and ∆pspA from the middle stationary phase showed that ∆pspA had more cells with dark foci. Quantification of proportion of cells with dark foci from the above bright-field images (right panel). (B) Bright-field and fluorescence images of HslU-TC-FlAsH labeled cells in wild type and ∆pspA showed that ∆pspA had more cells with HslU-TC-FlAsH fluorescence foci, which acted as the biomarker of protein aggresomes. The cells outlined by yellow dotted line displayed co-localization of HslU-TC-FlAsH fluorescence foci and dark foci within cells. Quantification of proportion of cells with HslU-TC-FlAsH fluorescence foci from the images (right panel). (C) Bright-field images of ∆pspA treated with or without 40 mM MOPS from the middle stationary phase showed that MOPS prevented dark foci formation within ∆pspA cells. Quantification of proportion of cells with dark foci from the bright-field images (right panel). (D) Lack of pspA accelerated intracellular protein aggresome formation under CCCP treatment. The wild type and ∆pspA cells from early stationary phase were split into two tubes, one tube with 20 µM CCCP for 1.5 h, and the other tube with no CCCP for 1.5 h. The proportion of cells with dark foci was calculated from the bright-field images of different samples. Scale bar, 3 µm. Each data bar indicates the mean ± standard deviation of at least three independent experiments. The significance of the two data bars, indicated by a line and asterisks spanning above them, was analyzed via two-tailed Student’s t test. *, P < 0.05; **, P < 0.01; ***, P < 0.005.

