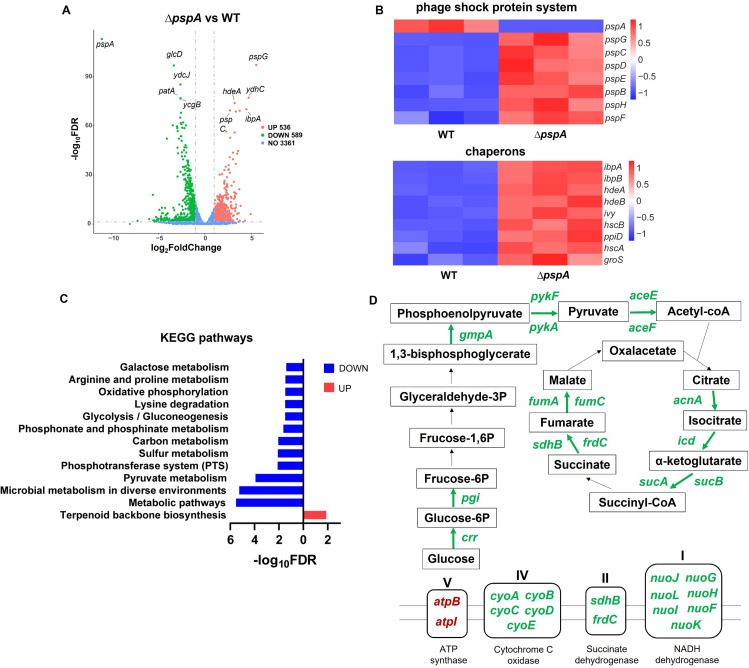
Fig 5.
The transcriptome analysis between ∆pspA and wild type. (A) Volcano plot of DEGs between ∆pspA and wild type. The DEGs were defined on the basis of the absolute fold change >2 and the adjusted P value (FDR) < 0.05. (B) Heat maps indicated the normalized expression of DEGs belonging to phage shock protein system and chaperons in wild type and ∆pspA. (C) Significantly enriched KEGG pathways of downregulated (blue) and upregulated (red) genes from DEGs. The significantly enriched KEGG pathways were defined on the basis of the adjusted P value (FDR) < 0.05 through DAVID website. (D) Upregulated and downregulated genes in the ATP-generating pathways, including glycolysis/gluconeogenesis, TCA cycle, and oxidative phosphorylation. The DEGs were labeled in the specific position of the schematic diagram according to their function. The genes with green color represented the downregulated genes in ∆pspA, while the genes with red color represented the upregulated genes. The genes whose expression levels did not change significantly according to our criteria for DEGs were not labeled in this diagram.

