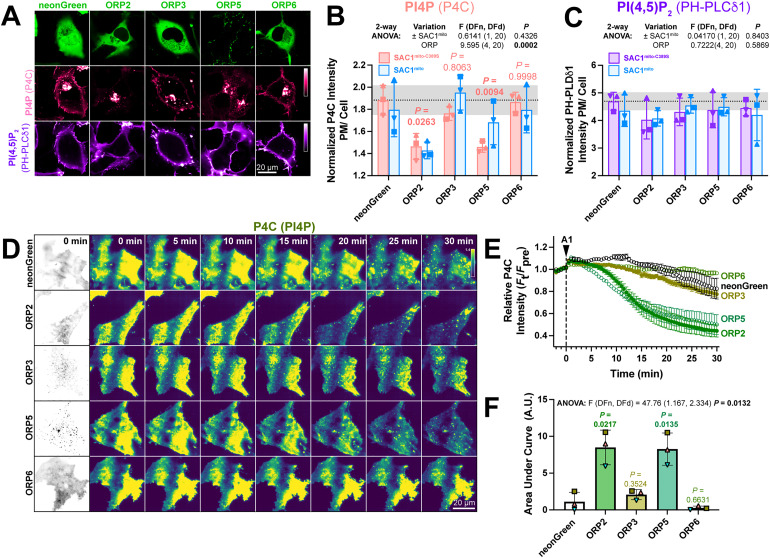
Figure 5.
ORP2 over-expression accelerates PM PI4P turnover (A) Representative confocal micrographs of COS-7 cells over-expressing the indicated neonGreen-tagged ORP construct (or neonGreen alone as control) together with the mCherry-P4C PI4P and iRFP713-PH-PLCδ1 PI(4,5)P2 biosensors and the inactive TagBFP2-SAC1mito−C389S (not shown). (B) Quantification of the relative PM intensity of PI4P biosensor in COS-7 cells expressing SAC1mito−C389S (pink) or SAC1mito (cyan); bars are grand means ± SD of three experiments, while symbols show the mean of 26–57 cells from each individual experiment. Results of a two-way analysis of variance are shown above the graph; the P values in pink are from Sidak's multiple comparison test, comparing the SAC1mito−C389S-transfected experiments with the respective control group. (C) As B, but for the PI(4,5)P2 biosensor. (D) TIRFM images of COS-7 cells over-expressing the indicated neonGreen-ORP construct and the mRFP-P4C biosensor. Time-lapse imaging of the P4C sensor is shown with the time since application of 30 nM GSK-A1 to inhibit PI4KA indicated. (E) Quantification of P4C fluorescence intensity shown in D; data are grand means of 3 experiments. (F) Quantification of the area under the curve from E. Bars are grand means ± SD of three experiments; data points are means of 5–12 cells from individual experiments. Results of a one-way ANOVA are indicated above the graphs, with P values above the graphs from a Dunnett's multiple comparison test comparing with the control, neonGreen group.

