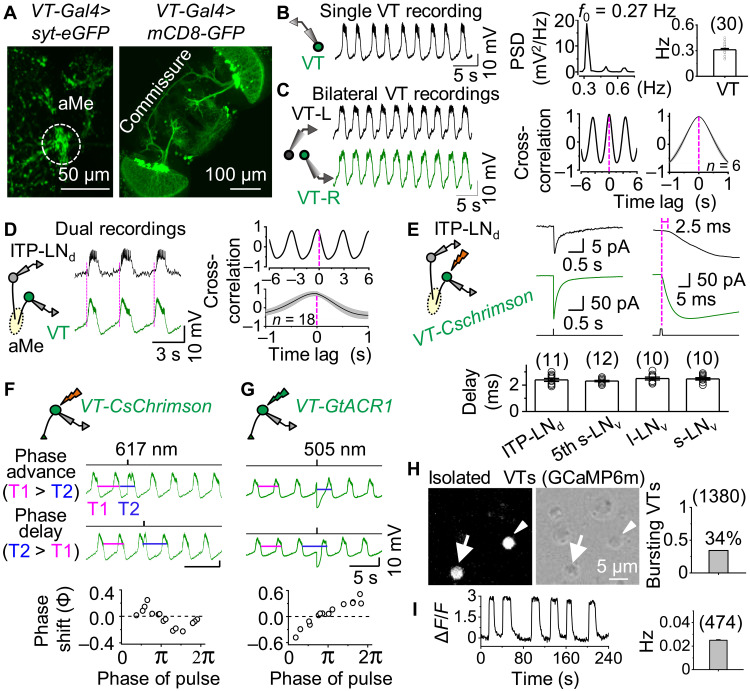
Fig. 3. Identification of bona fide ultradian electrical oscillators.
(A) Expression pattern of VT037867-Gal4. Left, aMe projections revealed by syt.eGFP; right, commissure revealed by GFP. (B) Rhythmic bursts in VT037867 neurons. Representative recordings of VT037867 neurons (left), power spectral analysis (middle), and combined data (right). (C) Representative bilateral VT037867 pair recordings (left), cross-correlation analysis (middle), and combined data (right). (D) Schematic of dual recordings from ipsilateral VT037867 and ITP-LNd pair (left), representative recordings (middle), and cross-correlation analysis (right). The rising phase of each VT037867 burst is marked by the magenta dotted lines, appearing earlier than that of ITP-LNd bursts. (E) Schematic of optogenetic activation and dual recordings of ipsilateral VT037867 and ITP-LNd pair (top, left), representative recordings with time scales expanded (top, right), and combined data of synaptic delay (bottom). Optogenetic stimulation: 617 nm, 1 ms, and 600 μW. (F) Schematic of CsChrimson-induced depolarization of VT037867 neurons (top), phase advance and delay (middle), and phase response curve (PRC; bottom). Phase advance: T1 > T2; phase delay: T1 < T2. Optogenetic stimulation: 617 nm, 150 ms, and 30 μW. Similar results obtained in three other VT037867 neurons (fig. S3G). (G) Schematic of GtACR1-induced hyperpolarization in VT037867 neurons (top), phase advance and delay (middle), and PRC (bottom). Optogenetic stimulation: 505 nm, 300 ms, and 40 μW. Similar results obtained in five other VT037867 neurons (fig. S3H). (H) Fluorescence image of isolated GCaMP6m-expressing VT037867 neurons (left), DIC image of enzymatically dissociated VT037867 neurons (middle), and combined data (right). Arrow and arrowhead mark two GCaMP6m-expressing VT037867 neurons; arrowhead indicates VT037867 neuron exhibiting calcium oscillations (474 of 1380 exhibited oscillations in eight independent replicates). (I) Representative calcium oscillations in isolated VT037867 neurons (left) and combined frequencies of oscillating VT037867 neurons (right). ΔF/F, change of calcium fluorescent intensity. Combined data are presented as means ± SEM.

