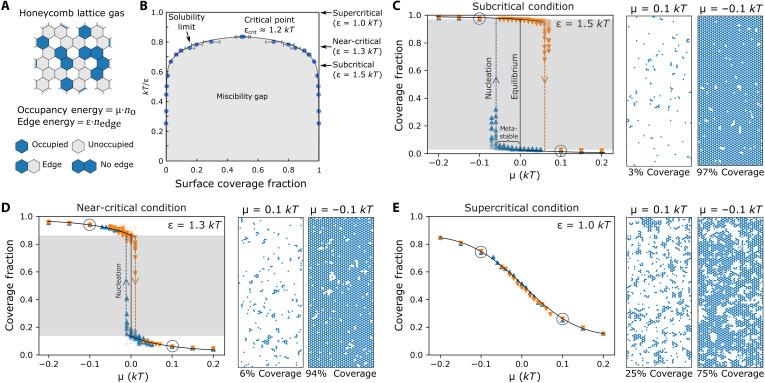
Fig. 3. Monte Carlo simulations of a noncharging 2D lattice gas.
(A) Schematic of the 2D honeycomb lattice simulation construction. (B) Corresponding phase diagram determined through Monte Carlo simulations, showing miscibility gap for ε > 1.2 kT. (C to E) Summaries of Monte Carlo simulations for three values of ε. Right: Images of each subfigure show equilibrium configurations at μ = 0.1 kT and μ = −0.1 kT. Left: Plots of each subfigure show surface coverage versus μ. Blue triangle (▲) symbols represent simulations initialized from zero coverage; orange inverted triangle (▼) symbols represent simulations initialized with full coverage. Circled points correspond to configurations plotted on right-hand side. Black curves indicate the equilibrium coverage, and gray bands denote the unstable coverage range within the miscibility gap. Dashed colored lines (with trailing symbols) represent potential trajectories across the coverage gap. (C) A subcritical system (ε = 1.5 kT), which only allows very high (>95%) or very low (<5%) coverages. Conditions with |μ| < 0.05 may persist within the gap during the simulation, but rapid nucleation is observed when |μ| exceeds 0.07 kT. (D) A near-critical system (ε = 1.3 kT), in which higher stable coverages (~15%) can be achieved but very small supersaturations with |μ| < 0.01 kT can induce nucleation. (E) A supercritical system (ε = 1 kT), where the coverage becomes a smoothly varying function of μ and all coverages can be attained, including states with high populations of fluctuating clusters.

