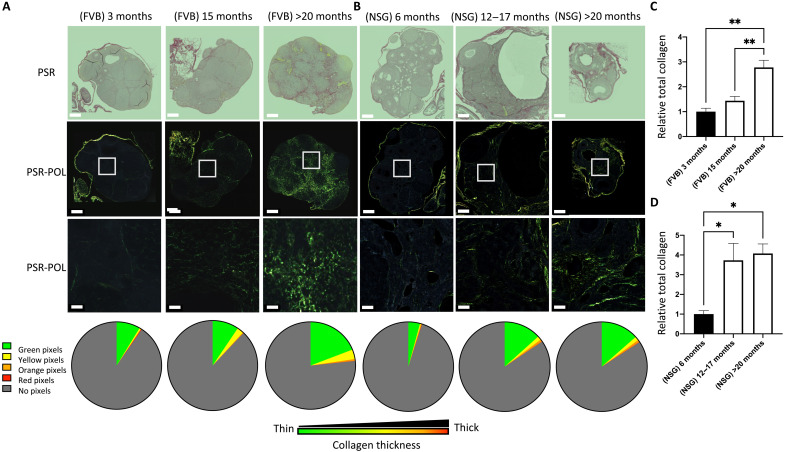
Fig. 3. Ovarian fibrosis significantly increases in advanced age in both FVB/N and NSG mice.
PSR-stained whole ovarian tissue from (A) immune-competent FVB/N mice and (B) immunodeficient NSG mice under bright-field (PSR) and polarized light (PSR-POL). Scale bars, 250 μm. The bottom is an enlargement of the white square in PSR-POL, for better visualization of the collagen fiber distribution and color. Scale bars, 20 μm. For each group, collagen thickness quantification is represented in a pie chart for each HUE pixel: green (thin fibers), and yellow, orange, and red (thick fibers). (C) Quantification of collagen deposition for immune-competent FVB/N mice and (D) immunodeficient NSG mice by quantifying the average of total collagen in whole ovaries from all experimental conditions relative to young mice. Data are means ± SEM (*P < 0.05 and **P < 0.01).

