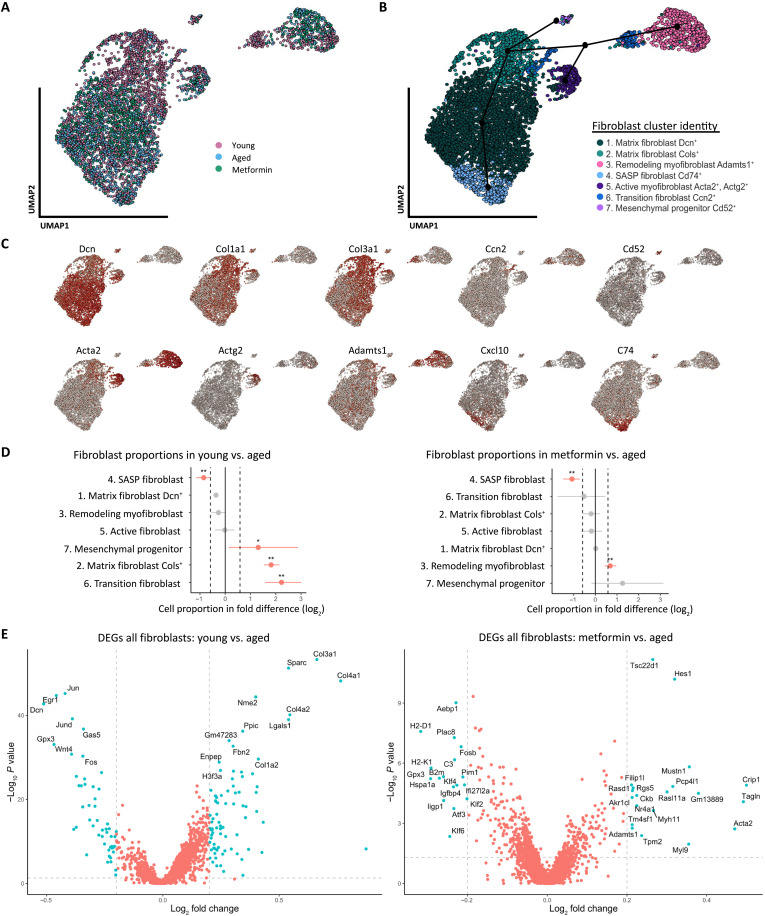
Fig. 5. Dynamic changes in ovarian fibroblasts revealed distinct shifts in population proportions in aged and metformin-treated mice.
(A) Projection of the 5361 single cells belonging to fibroblast/myofibroblast I and II compartments of the original data, analyzed, and reclustered in a two-dimensional (2D) projection of single cells onto a graph representation by color for each condition. (B) Cells were associated with seven fibroblast states, annotated, and marked by color. The suggested pseudotrajectory from all fibroblast states is represented by black dots and lines on the 2D map. (C) Expression of key cell state–specific marker genes on top of the 2D map of ovarian fibroblasts. (D) Graph of the permutation test of each fibroblast cluster and the single-cell proportion differences between young versus aged and metformin versus aged. Dotted lines indicate the threshold for a fold change of 1.5 (log2 = 0.58), and red dots represent the significance of a change in cell proportion between groups compared [*FDR (false discovery rate) < 0.05, **FDR < 0.01]. (E) Differential gene expression of all fibroblasts derived from young versus aged and metformin versus aged ovaries. Vertical dotted lines indicate the threshold for a fold change of 1.25 (log2 = 0.3), and the horizontal dotted line indicates the P value threshold of 0.05 (−log10 = 1.3), Blue dots are significant DEGs that meet 1.25-fold change and P value <0.05. Red dots are not significant DEGs.

