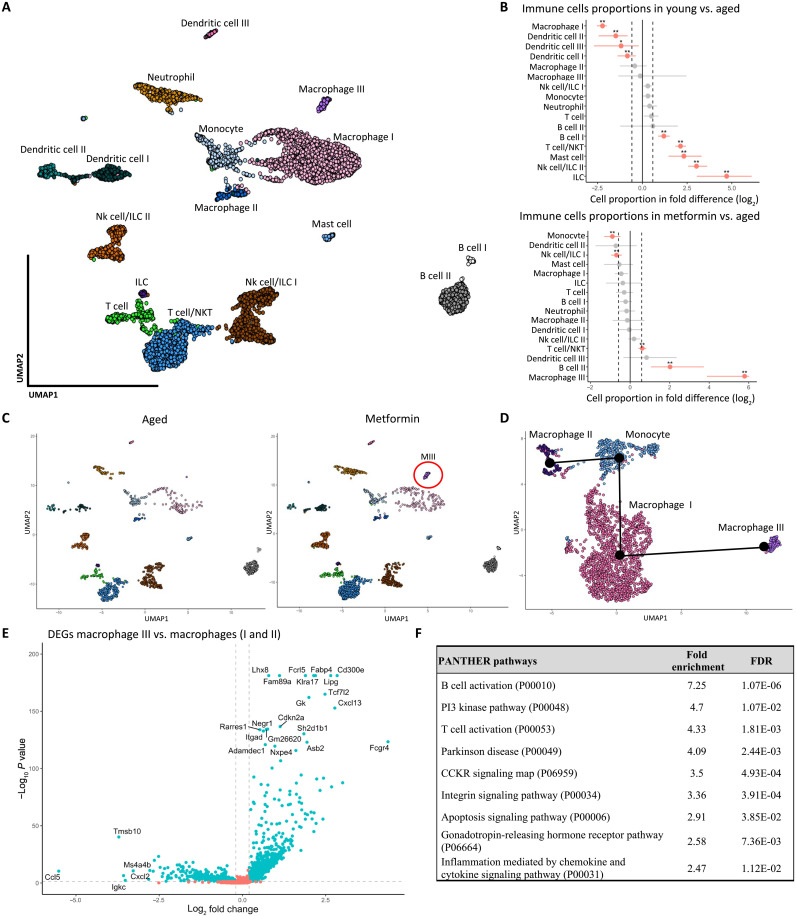
Fig. 7. A single-cell map of ovarian immune cells revealed a metformin-responsive macrophage population.
(A) Projection of the 6171 single cells belonging to immune (CD45+) compartments. Cells were associated with 16 immune cell types, annotated, and marked by color. (B) Graph of the permutation test of each immune cluster and the single-cell proportion differences between young versus aged and metformin versus aged. Dotted lines indicate the threshold for a fold change of 1.5, and red dots represent a significant change in cell proportion (*FDR < 0.05, **FDR < 0.01). (C) Comparison of the single cells belonging to aged and metformin-treated groups in a 2D map. The red circle shows the emergence of a metformin-responsive population of macrophages (MIII), annotated macrophage III. (D) Projection of the 2201 single cells belonging to the macrophage and monocyte compartments. The suggested pseudotrajectory from all compartments is represented by black lines on the 2D map. (E) Differential gene expression analysis of the macrophage III against all macrophages. Dotted lines indicate the threshold for a fold change of 1.25 and the P value of 0.05. (F) Results from the statistical overrepresentation test of pathways in PANTHER based on the DEGs from macrophage III, showing the fold enrichment of each pathway and the adjusted P value (FDR).

