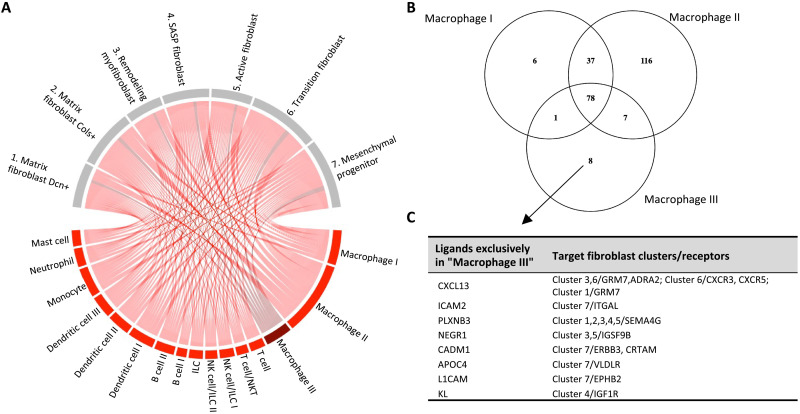
Fig. 8. Ligand-receptor analysis of ovarian immune cells revealed a unique set of ligands to the metformin group.
(A) LIANA ligand-receptor analysis of ligand (red) produced from immune cells that have receptors (gray) in the fibroblast clusters. Dark red represents the ligand produced by the responsive population of macrophage III unique to the metformin group. (B) Venn Diagram comparing the expression of ligands in each macrophage compartment, revealing eight ligands that are exclusively expressed in the macrophage III cells. (C) List of the eight ligands from macrophage III cells and their respective fibroblast cluster target and receptor.

