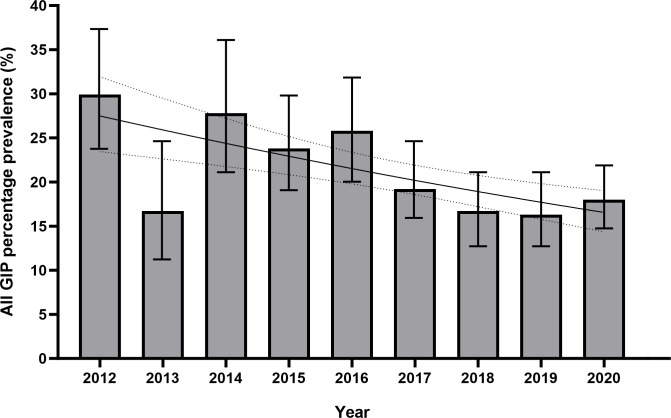
Fig 2. Bar chart and logistic regression curve of combined gastrointestinal parasite (GIP) infection prevalence in Nepalese Gurkha recruits who migrated to the UK by year, 2012–2020.
Details of GIP infections identified are shown in Table 1. Logistic regression was statistically significant (p<0.001, OR 0.923, 95% CI 0.886–0.960) for a negative association with total GIP prevalence and time in years. If data for outlier year 2013 are excluded, this association is stronger (p<0.001, OR 0.903, 95% CI 0.865–0.942). Figures are %, bars show 95% CI. Logistic regression curve shown with 95% CI.

