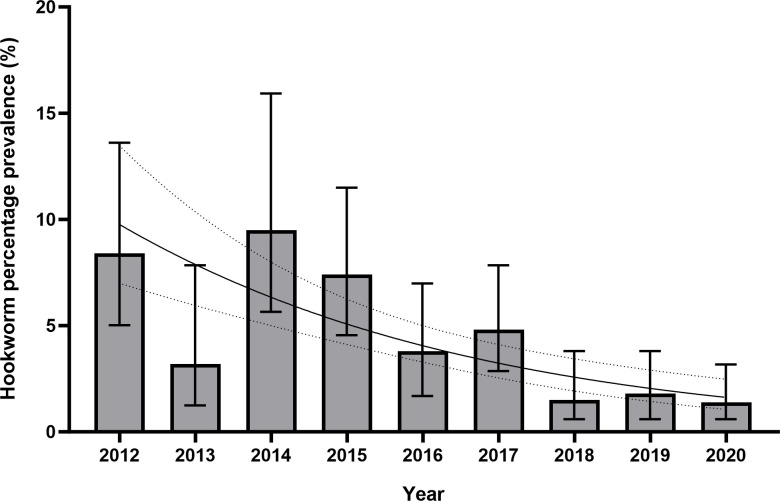
Fig 4. Bar chart and logistic regression curve of yearly prevalence of hookworm infection in Nepalese Gurkha recruits who migrated to the UK 2012–2020.
Logistic regression was statistically significant (p<0.001, OR 0.791, 95% CI 0.729–0.860) for a negative association with hookworm prevalence and time in years. Figures are %, bars show 95% CI. Logistic regression curve shown with 95% CI.

