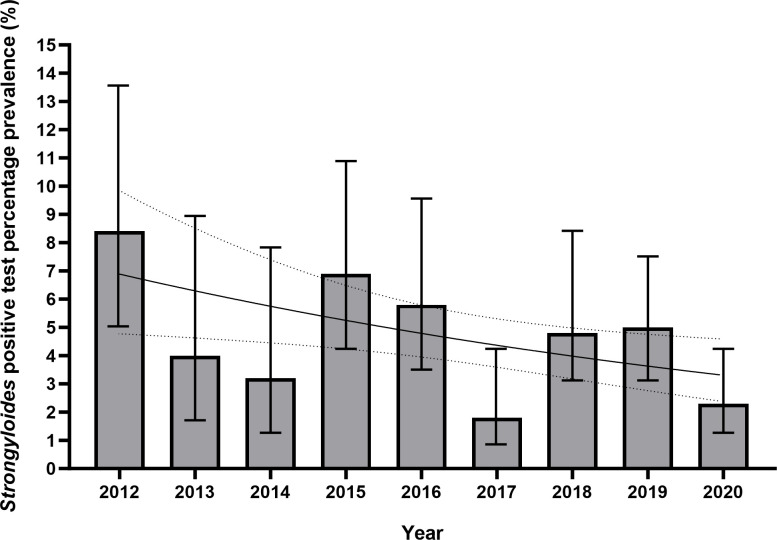
Fig 5. Bar chart and logistic regression curve of yearly positive S. stercoralis results (both charcoal culture and IgG ELISA), in Nepalese Gurkha recruits who migrated to the UK 2012–2020.
Logistic regression was statistically significant (p = 0.013, OR 0.908, 95% CI 0.842–0.980) for a negative association with a positive S. stercoralis test and time in years. Figures are %, bars show 95% CI. Logistic regression curve shown with 95% CI.

