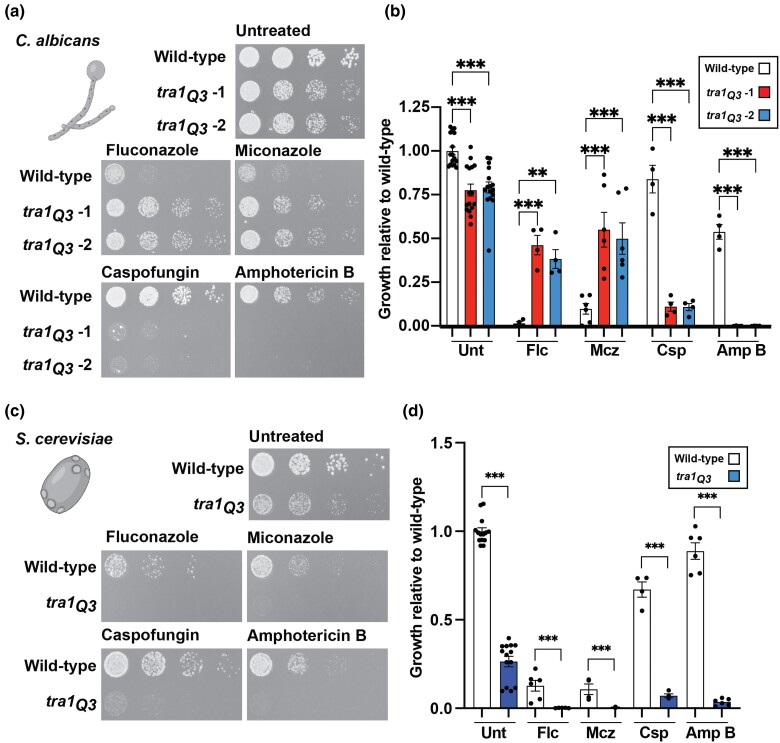
Fig. 1.
tra1Q3 results in differential resistance to azoles across yeast species. a) Wild-type and tra1Q3 C. albicans cells were spotted on YPD agar plates at 30°C without treatment or containing either 20 µg/mL fluconazole (Flc), 0.5 µg/mL miconazole (Mcz), 0.05 µg/mL caspofungin (Csp), or 0.5 µg/mL amphotericin B (Amp B). b) Quantification of the growth relative to untreated wild type is shown in the bar graph. The second dilution was used for quantification. Data are presented ± SEM n ≥ 4 and ***P < 0.0003; **P < 0.01. c) Wild-type and tra1Q3 S. cerevisiae cells were spotted on YPD agar plates at 30°C without treatment or containing either 20 µg/mL Flc, 0.3 µg/mL Mcz, 0.10 µg/mL Csp, or 0.5 µg/mL Amp B. d) Quantification of the growth relative to untreated wild type is shown in the bar graph. Second dilution was used for quantification. Data are presented ± SEM n ≥ 4 and ***P < 0.0003. Yeast illustrations were generated using biorender.com.

