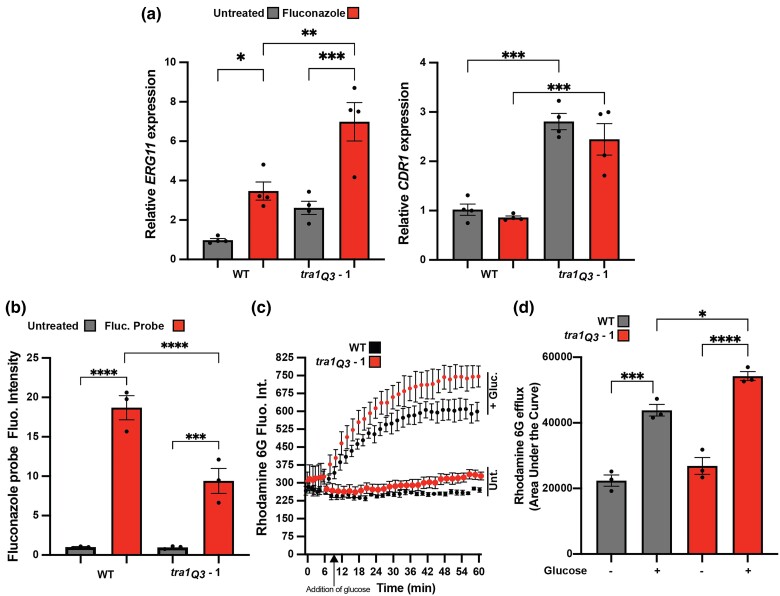
Fig. 2.
Candida albicans tra1Q3 mutants display phenotypes associated with azole resistance. a) tra1Q3 cells show increased expression of genes linked to azole resistance. Wild-type and tra1Q3 C. albicans cells were incubated with 20 µg/mL fluconazole for 1 h and the expression of ERG11 and CDR1 was assessed by qRT-PCR. n = 4. b) tra1Q3 cells show reduced accumulation of intracellular fluconazole. Wild-type and tra1Q3 C. albicans cells were incubated with a fluorescent fluconazole probe for 1 h, and mean fluorescent intensity of intracellular fluconazole was assessed by flow cytometry. n = 3. c) R6G efflux is increased in tra1Q3 cells. Energy-depleted cells were incubated with R6G for 1 h and then left untreated or treated with glucose to induce efflux. Mean rhodamine 6D fluorescence was monitored over time. n = 3. d) Quantification of the area under the curve calculated from R6G release assays is shown in the bar graph. n = 3. Means are shown ± SEM ****P < 0.0001; ***P < 0.0003; **P < 0.01; *P < 0.05.

