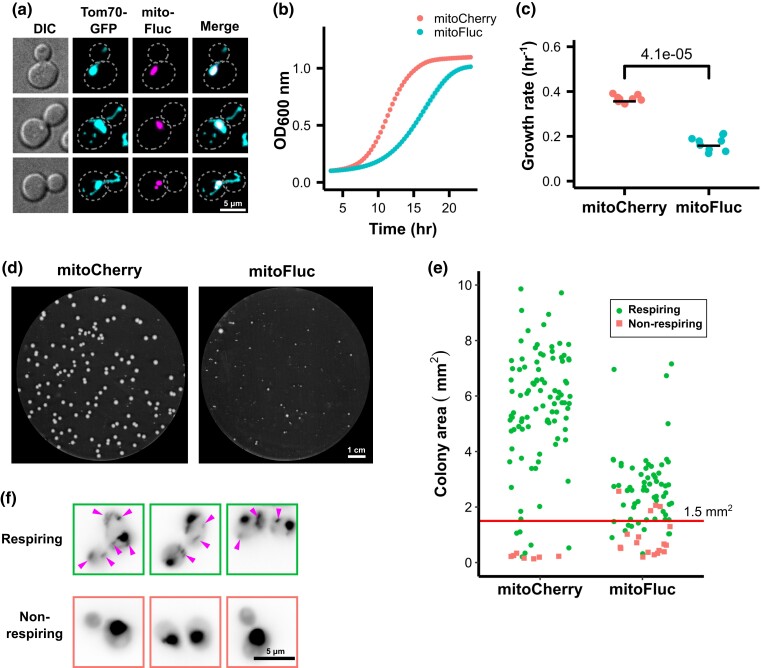
Fig. 1.
Mitochondrial unfolded protein stress impairs growth and induces mtDNA loss. a) Fluorescence image of yeast cells expressing an aggregation-prone, mitochondria-targeted synthetic protein (mitoFluc) tagged with mCherry and with the outer mitochondrial membrane protein Tom70 tagged with GFP. b) Growth curves of cells expressing either mitoCherry or mitoFluc. Optical density at 600 nm (OD600) was measured every 20 minutes; points represent means and shading (partly obscured) represents standard error of 8 biological replicates. c) Exponential growth rates of cells expressing either mitoCherry or mitoFluc. Constants determined by log-linear fit to the OD600 curves. Black bar indicates mean of 8 biological replicates. P value from 2-tailed t-test. d) YPD plate of yeast colonies expressing either mitoCherry or mitoFluc. e) Assay for respiratory competence by colony size. Each dot represents 1 yeast colony. After area measurement, colonies were patched on YPG plates to test for respiratory growth. Line at 1.5 mm2 indicates the threshold chosen to define the petite colony phenotype, which yields similar false-positive petite calls between the strains. Green circles represent respiring colonies, red squares represent non-respiring colonies. f) Representative images of cells from respiration-competent and respiration-negative colonies with DNA stained by DAPI. Magenta arrows indicate mtDNA nucleoids, and the large DAPI spots are cell nuclei.

