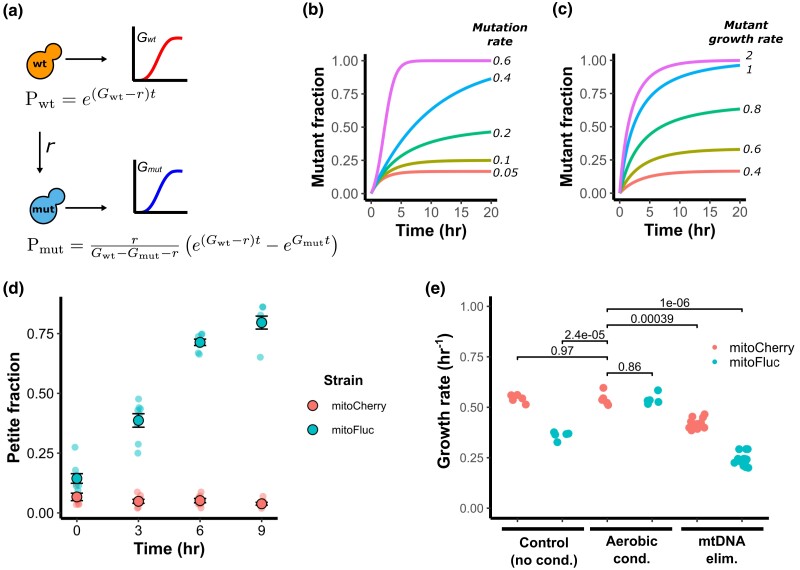
Fig. 2.
Modeling and determination of mtDNA loss rate in a growing cell population. a) Schematic of 2-state model of mtDNA loss in a growing population. Gwt is the growth constant of the wild-type cells, Gmut is the growth constant of the mutated ρ0 cells, r is the rate of mtDNA loss, Pwt is the population size of wild-type cells, Pmut is the population size of mutant ρ0 cells, t is time since the foundation of a population. b) Simulated population proportion of mtDNA mutants for a range of mutation rates and c) mutant growth rates. d) Time-resolved assay of mtDNA loss during mitochondrial protein stress. Cultures were kept in exponential growth phase for experiment duration by dilution with new media to avoid selecting for respiring cells. Circles represent measured petite frequencies in independent biological replicates, black circles indicate the population-weighted mean petite fraction from 8 biological replicates, error bars represent simple SEM of petite frequencies between each replicate (unweighted). e) Effect of mitochondrial modifiers on growth rate. Dots indicate rates from independent biological replicates. P values are calculated from a 2-tailed t-test.

