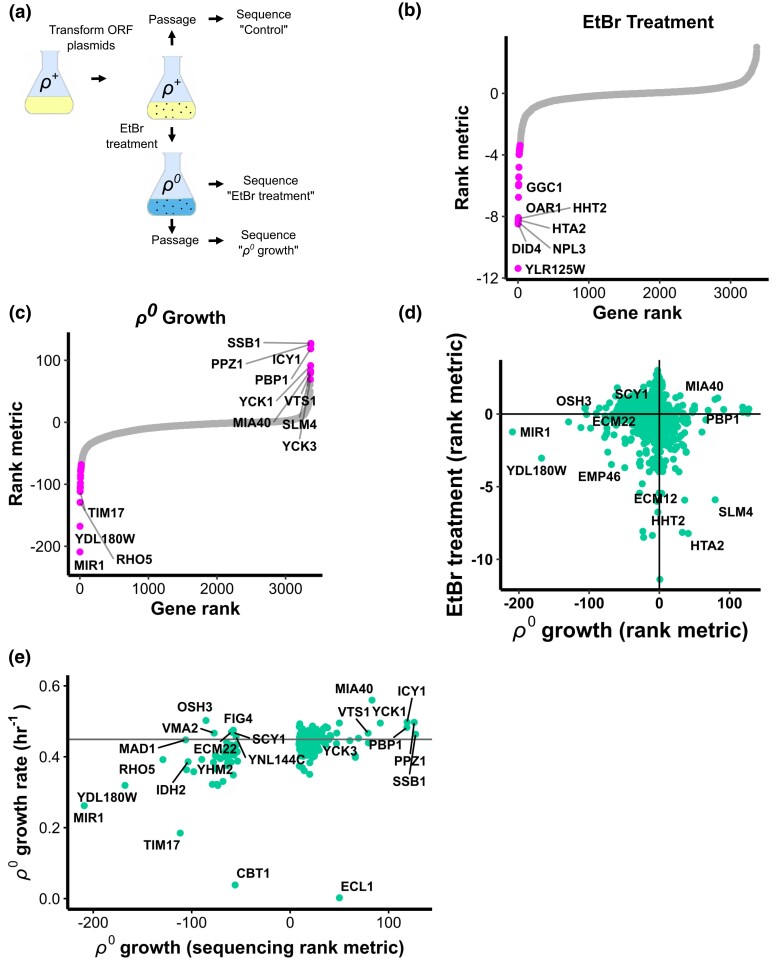
Fig. 4.
Genome-wide screen for dosage suppressors of mtDNA stress. a) Schematic of how 3 samples were prepared for barcode sequencing screen. b) Enrichment of gene dosage increase plasmids during EtBr treatment. Rank metric is the negative, base-10 logarithm of the raw P value associated with a gene's differential enrichment multiplied by the sign of the logarithm of its fold-change (i.e. negative for plasmid depleted and positive for enriched). Genes are rank ordered along the x axis. P values calculated from 3 biological replicates. Genes for which P < 0.05 after applying Benjamini–Hochberg (BH) correction for false discovery feature magenta dots. c) Enrichment of gene dosage increase plasmids during ρ0 growth. Plot elements as in B, except that points are magenta for P < 10−65 after BH correction. d) Comparison of EtBr and ρ0 growth experiments. e) Summary plot comparing ρ0 growth barcode sequencing screen and ρ0 growth rate screen results. Horizontal line indicates the growth rate of the control strain.

