Fig. 1.

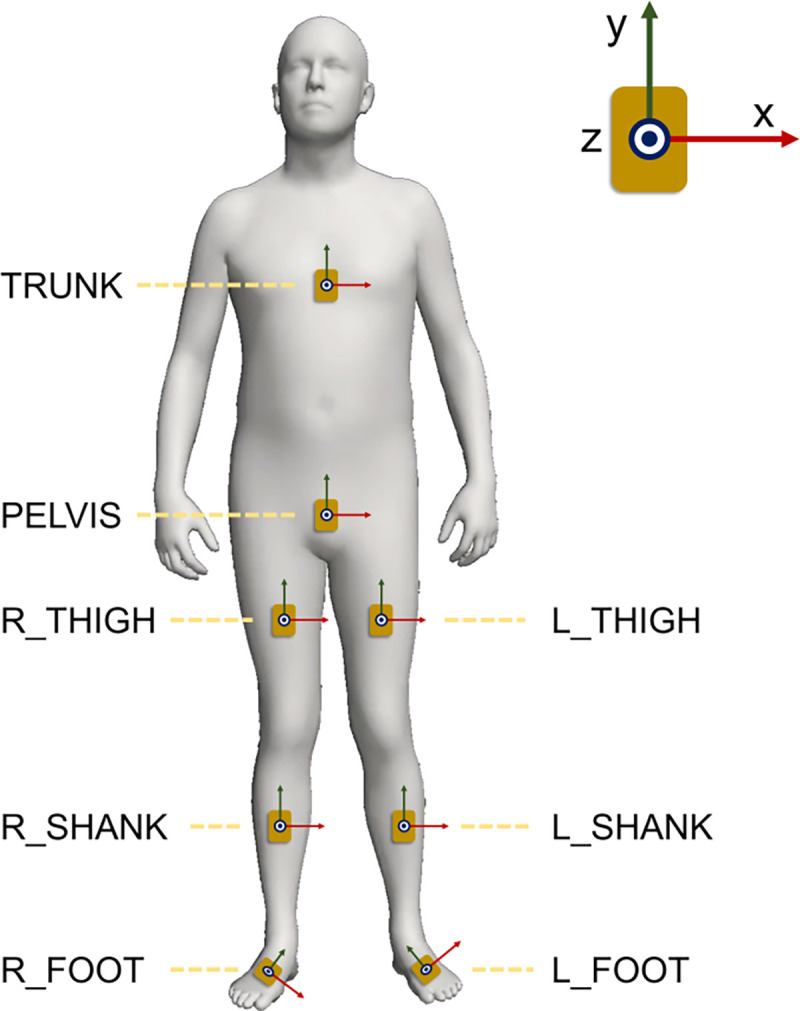
Locations and orientations of eight synthetic IMUs generated from the AMASS dataset. Red arrows, green arrows, and blue dots represent x-, y-, and z-axes of IMUs, respectively.

Locations and orientations of eight synthetic IMUs generated from the AMASS dataset. Red arrows, green arrows, and blue dots represent x-, y-, and z-axes of IMUs, respectively.