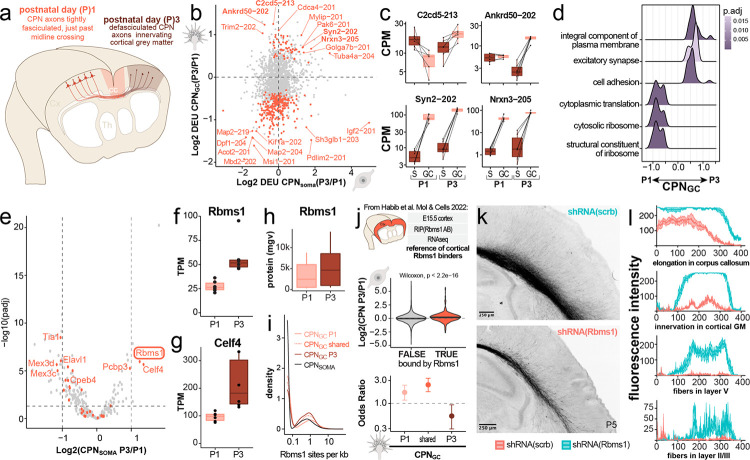
Figure 5: GC-localized transcripts change dynamically across developmental stages.
(a) Schematic of CPN GC locations and growth state at P1 (fasciculated, just past midline crossing) and P3 (defasciculated, innervating contralateral gray matter containing target neurons). (b) Quadrant plot displaying changes in 3’UTR isoform usage (differential exon usage, DEU) from P1 to P3 in CPN somata (x-axis) and GCs (y-axis), respectively. The most significant changes in transcript isoform usage are found in GCs, resulting in a predominantly vertical distribution. (c) Boxplots highlighting examples of temporally shifting candidate transcript isoforms, displaying TPM across compartments (GCs pink, somata brown) and developmental stages (P1 vs. P3). (d) Gene set enrichment analysis comparing functional sets of transcripts changing from P1 to P3 in GCs reveals an increase in GC-local transcripts associated with cation transport and excitatory synapse formation. (e) Differential RNA expression comparing CPN somata at P3 vs. P1 of RBPs annotated by the GO term 0003729; orange dots indicate RBPs; grey dots indicate non-RBP transcripts. Labeled dots highlight genes that are associated with motifs enriched in GCs over somata (see Fig 4). (f & g) Boxplots highlighting RNA expression changes of Rbms1 and Celf4, the two RBPs for which expression by CPN increases the most from P1 to P3, and which likely have GC-localized functions. (h) Mean gray value of RBMS1 protein labeling in somata of primary CPN plated at P1 (pink) or P3 (brown). (i) Motif scanning for RBMS1-associated motifs in 3’UTRs detected as GC-localized at P1, P3, or at both developmental stages (shared). Lighter and darker shades of red indicate the proportion of RBMS1-associated motifs detected in respective 3’-UTRs. (j) Cross-referencing of subcellular transcriptomes identified here with previously published RBMS1 RIP-seq data from homogenized embryonic cortex21 reveals higher abundances of RBMS1-bound transcripts at P3 vs. P1 in CPN somata (middle panel), but de-enrichment of RBMS1-bound transcripts in CPN GCs at P3 vs. P1 (lower panel). (k) Constitutive shRNA knockdown of Rbms1 (red, n = 4) in CPN by in utero electroporation results in fewer axons elongating into the corpus callosum (cc) and innervating the contralateral gray matter when compared to CPN treated with a scrambled control shRNA (scrb, teal, n = 5), quantified in (l) as mean gray value (mgv, mean ± sem).

