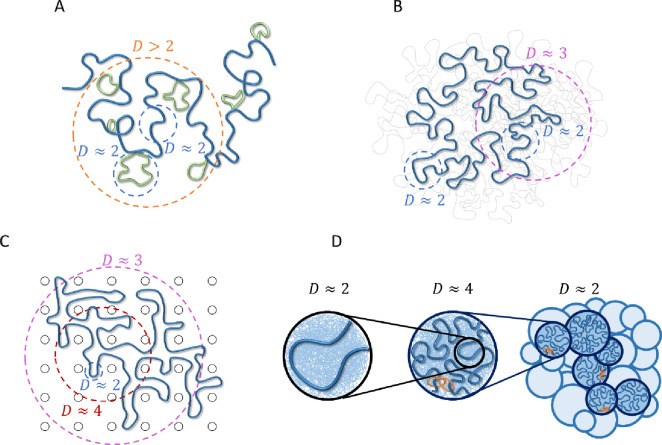
Figure 3:
Polymer models relevant to chromatin organization consistent with fractal dimension D > 2. Dashed circles indicate typical length scales with a given fractal dimension. A) CPEL (44, 46). Looped and un-looped sections of the same polymer chain are drawn in green and blue, respectively. B) FLG (47). Fractal behavior is shown for one polymer ring of interest (thick blue curve). Thin gray curves represent other polymers in a melt. C) DFLA (48, 49). Fractal behavior is shown for one polymer ring of interest (thick blue curve). Black circles represent obstacles created by fixed networks. D) Active loop extrusion (this paper). Short, relaxed sections of chromatin with fractal dimension (left) pack together to form extruded loops with (center, where the most recently extruded section of a loop is shown in blue, the rest of the loop represented by the thin blue lines in the background, and orange rings represent cohesin). Extruded loops form a random walk (dark blue circles in the right-hand schematic) with surrounded by other chromatin sections (light blue circles). Models (A) – (C) are equilibrium, while (D) is non-equilibrium.

