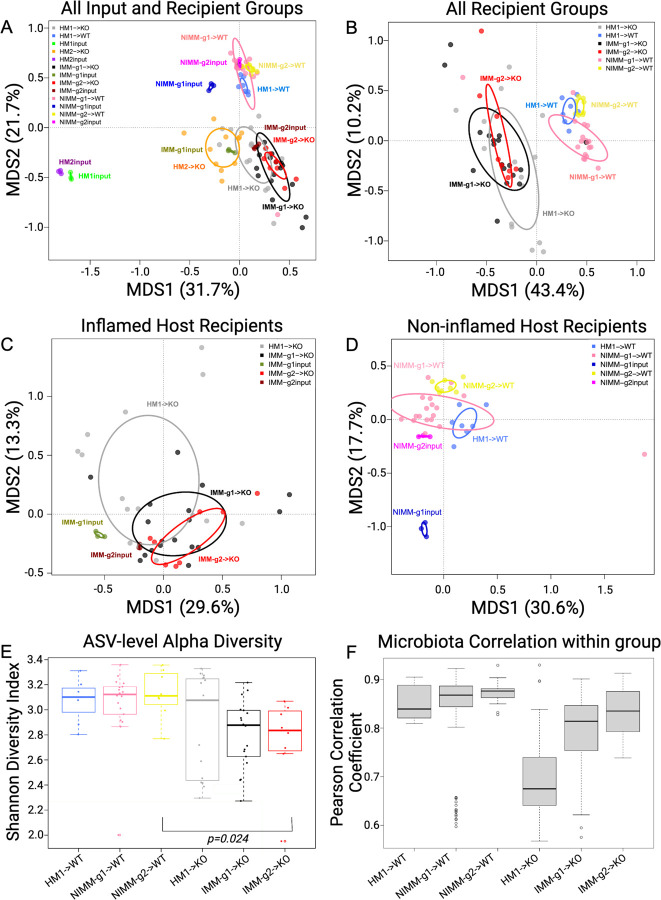
Figure 3. Human microbiome restructuring with transplant to GF mice is host inflammatory environment specific.
A) Principal coordinates analysis, PCoA, of 16S Seq data for human and mouse-adapted FMT inputs and FMT recipient WT and KO mouse groups. B) PCoA of FMT recipient WT and KO mouse groups. C) PCoA of FMT recipient KO mouse groups. D) PCoA of FMT recipient WT mouse groups. E) Shannon index at ASV level for FMT recipient WT and KO mouse groups. F) Pearson correlation coefficients (r) within group for FMT recipient WT and KO mouse groups quantify variability of microbiota composition between mice in the same group (microbiota engraftment consistency). Dots in PCoA plots represent individual mice for FMT recipient WT and Il-10−/− (KO) mouse groups. For FMT inputs, a single input slurry was used in each experiment and input dots represent sequencing data from three 16S amplicon PCR technical replicates. Analysis conclusions did not change when using average input vs individual technical replicates, so technical replicates are displayed to demonstrate the high consistency of 16S amplicon PCR in our dataset.

