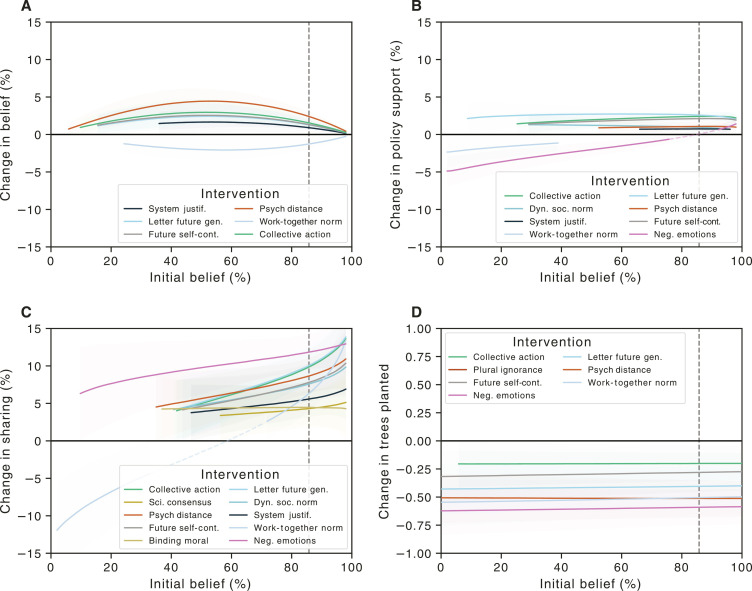
Fig. 3. Marginal effects (as the difference between interventions and control) as a function of estimated preintervention belief in climate change.
Lines indicate the average effect size, with shaded regions indicating the 94% credible region. For visual clarity, regions in which the 94% credible region overlap zero are omitted from the figure. Where interventions have positive and negative effects that meet these criteria, a dashed line is used to connect these regions. The dashed vertical line indicates average belief, where effects in Fig. 1 are estimated. (A) Climate change belief, (B) policy support, (C) sharing information on social media, and (D) trees planted via the WEPT.

