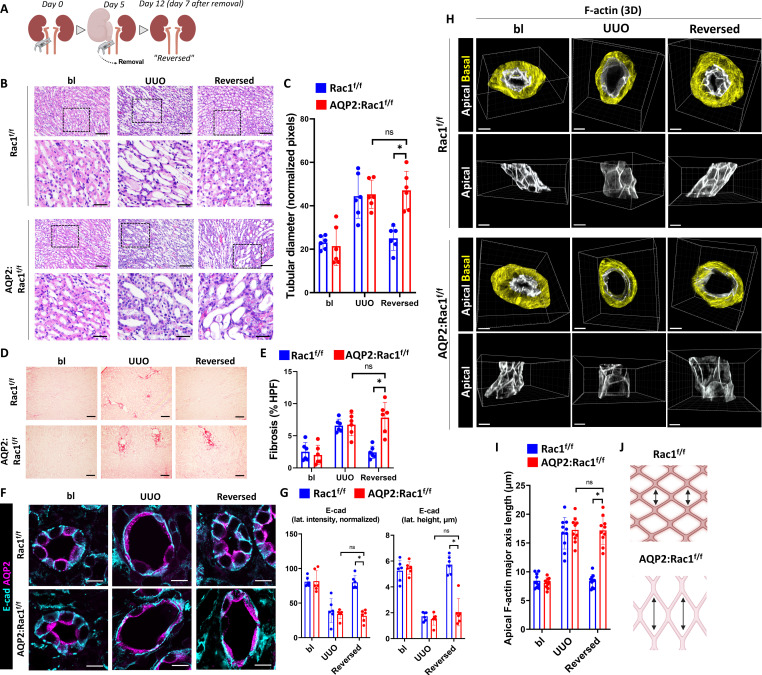
Fig. 2. Rac1 promotes CD repair, morphological reconstitution, and F-actin recovery.
(A) Schematic representation of the reversible UUO model outlining surgical clamp placement and removal for collecting system decompression. (B) H&E paraffin kidney sections of Rac1f/f and AQP2:Rac1f/f mice at baseline, after 5 days of UUO and 1 week after reversal of obstruction (“reversed”) in the top row (scale bars, 50 μm) with a black dashed box indicating insets shown below (scale bars, 20 μm). (C) Quantification of medullary tubular diameter in (B) in normalized pixels (normalized to frame size that was equal between groups). (D) Sirius Red stained kidney sections (scale bars, 100 μm). (E) Quantification of fibrosis in (D) as percent Sirius Red positive per HPF. (F) E-cadherin immunostaining was performed on paraffin kidney sections of baseline, obstructed, and reversed Rac1f/f and AQP2:Rac1f/f mice, and the CDs were marked by AQP2 (scale bars, 10 μm); sections were analyzed by confocal microscopy. (G) Quantification of normalized lateral E-cadherin intensity (left) and lateral E-cadherin height in micrometers (right) from (F) using ImageJ. (H) 3D reconstructions of AQP2-positive F-actin–labeled CDs with segmentation and masking of the basolateral (yellow) and apical (white) F-actin using Imaris. Top rows display a top view of both masking channels, and bottom rows show side views of apical F-actin. n = 6 mice per group. Scale bars, 5 μm. (I) Quantification of the apical F-actin major axis length in micrometers (details in Materials and Methods) with each dot in the scatter plots representing measurements. (J) Schematic depiction of the results showing abnormal longitudinal extension of the apical F-actin meshwork of repairing AQP2:Rac1f/f CDs. Bars are means ± SD. ns, not significant. *P < 0.05. Panels (A) and (J) were created with Biorender.com.

