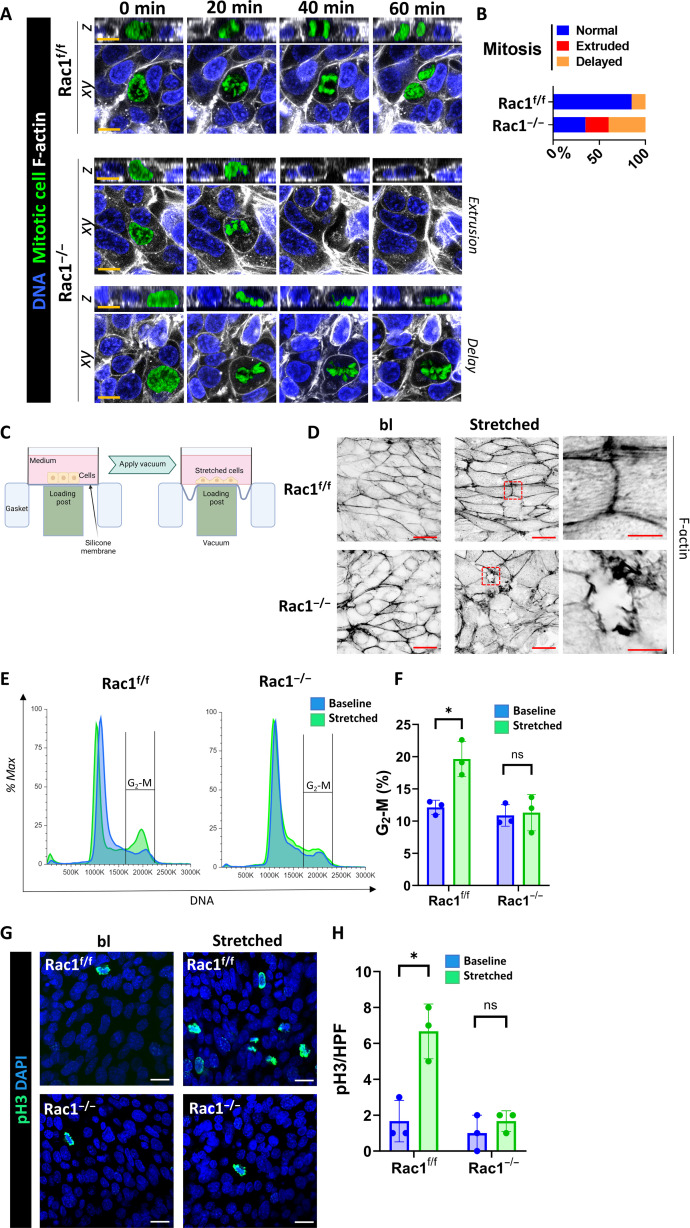
Fig. 4. Rac1 promotes mitotic progression, F-actin integrity, and a G2-M cell cycle shift after CD cell injury in vitro.
(A) Live confocal mitosis imaging of SPY650-DNA (blue)– and SPY555-actin (white)–labeled CD cells in vitro. Orthogonal Z-slices are also shown. Representative mitotic defects are shown for Rac1−/− CD cells. Scale bars, 10 μm. The mitotic cell was manually recolored in green. (B) Relative distribution of mitotic defects in vitro during live imaging cell division sequences with at least 10 mitoses analyzed per group. (C) Schematic presentation of the Flexcell bioreactor. Created with Biorender.com (D) Super-resolution confocal images of apical cross sections of phalloidin-647 (F-actin)–labeled Rac1f/f and Rac1−/− CD cell monolayers before stretch (baseline) and after stretch (“stretched”). Images are shown as color-inverted grayscale images and are representative of three repeat experiments (scale bars, 20 μm). The red dashed box indicates the region of the inset shown in the rightmost column (scale bars, 5 μm). (E) Representative flow cytometry cell cycle histograms of propidium iodide (“DNA”)–labeled CD cells in vitro before stretch (baseline; blue) and after stretch (stretched, green). Plots are normalized to mode (% max), and the indicated range highlights the G2-M population. (F) Quantification of the relative G2-M population with bars as means ± SD and each dot representing individual samples from three independent repeat experiments. (G) Baseline and poststretch (stretched) Rac1f/f and Rac1−/− CD cell monolayers were stained for mitotic cells (pH3; green) and nuclei (DNA; blue). Images are representative of three experiments. Scale bars, 20 μm. (H) Quantification of mitotic cells (pH3-positive) per HPF of Rac1f/f and Rac1−/− CD cells before stretch (baseline; blue) and after stretch (stretched; green). Individual dots represent repeat experiments, and bars are means ± SD. *P < 0.05.

