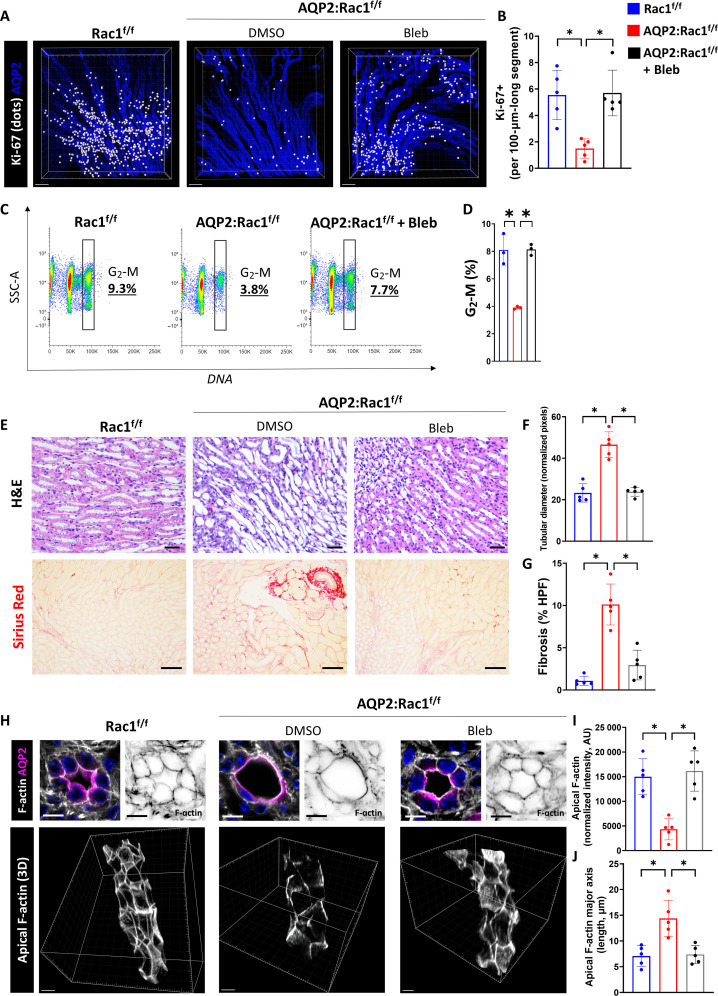
Fig. 7. Actomyosin inhibition reversed the repair defect of AQP2:Rac1−/− mice.
(A) Optically cleared medullary slices of reversed (repairing) mice labeled with AQP2 (CDs) and Ki-67. 3D reconstructions are shown. Ki-67 signal inside AQP2+ CDs was filtered and converted to white dots. Scale bars, 100 μm. (B) Quantification of (A) showing Ki-67–positive cells per 100-μm-long CD segment with dots representing individual mice (n = 5). (C) Flow cytometry plots of AQP2+ CD cells of reversed kidneys showing side scatter (SSC-A) against DNA (DAPI) with a G2-M phase–specific cell cycle gate. Subpopulation percentages are shown in the plot. (D) Quantification of G2-M CD cells with at least three mice (one dot) per group. (E) H&E paraffin kidney sections in the first row (scale bars, 20 μm) of medullary regions and Sirius Red staining in the second row (scale bars, 50 μm). n = 5 mice per group. (F and G) Quantification of medullary tubular diameter as normalized pixels and fibrosis (as percentage of Sirius Red–positive area per HPF) with dots representing individual mice. (H) F-actin labeling (white) of CDs (AQP2; magenta) in thick fresh frozen medullary kidney slices in reversed kidneys analyzed by 3D super-resolution confocal. First row depicts two cross sections (left original, right F-actin channel; scale bars, 10 μm), and second row shows oblique views of 3D reconstructions of the apical CD F-actin (scale bars, 7 μm). (I and J) Quantification of apical F-actin intensity and apical F-actin major axis length; dots represent individual mice. n = 5 mice per group. Bars are means ± SD. *P < 0.05.

