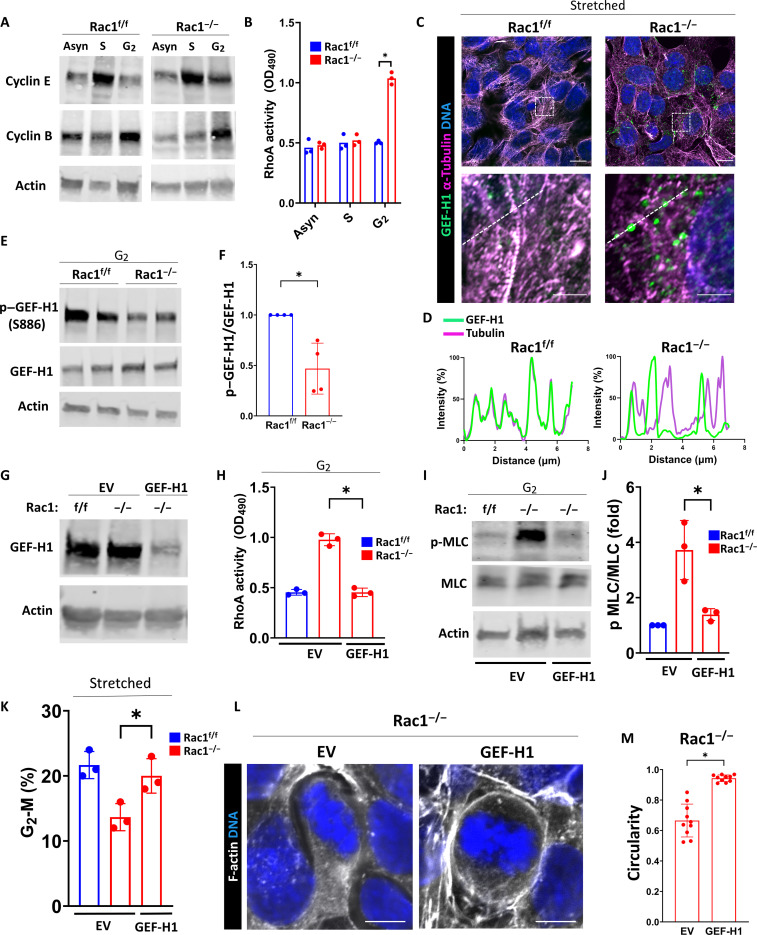
Fig. 8. Rac1 restricts myosin activation by inhibiting the RhoA activator GEF-H1.
(A) Immunoblots of asynchronous (Asyn), G1-S–synchronized, or S phase–synchronized CD cells to confirm cell cycle phase–specific enrichment (cyclin E, S phase; cyclin B1, G2 phase). OD490, optical density at 490 nm. (B) Quantification of RhoA activity (asynchronous, S, and G2) using G-LISA and measuring absorbance at 490 nm. Individual dots represent repeat experiments (n = 3). (C) Super-resolution confocal imaging of microtubules (magenta) and GEF-H1 (green) of CD cells after stretch. Scale bars, 10 μm (first row) and 2.5 μm (second row). The white dashed box indicates the region of interest for the insets in the second row. (D) Line scan profile (white dashed line) normalized to the highest (100%) and lowest (0%) intensity. Representative of three repeat experiments and 10 measurements per group. (E and F) Immunoblotting of G2-synchronized cell lysates for phosphorylated (serine-886, S886) and total GEF-H1 in biological duplicates. Three repeat experiments were quantified in (F). Fold change values ± SD. (G) Immunoblotting of empty vector (EV)–transfected or GEF-H1 knockdown short hairpin RNA (shRNA)–transfected CD cells. (H) Quantification of RhoA activity in G2 cell cycle fractions. Individual dots represent repeat experiments (n = 3). (I and J) Immunoblotting of G2 cell cycle fractions of EV or GEF-H1 knockdown transfected for total and pMLC (serine-19). The phospho-to-total myosin light chain (pMLC–to–t-MLC) ratio is shown as fold change ± SD with individual dots representing repeat experiments (n = 3). (K) Quantification of G2-M cell cycle fractions (in percentage) of the indicated groups after induction of proliferation using stretch by flow cytometry using propidium iodide. Individual dots represent experiments (n = 3). (L and M) F-actin (white)– and DNA (blue)–labeled mitotic metaphase EV- or GEF-H1 knockdown–transfected Rac1−/− CD cells (scale bars, 5 μm). Mitotic rounding (circularity) is quantified in (M) showing a minimum of 10 measurements per group. Bars are means ± SD. *P < 0.05.

