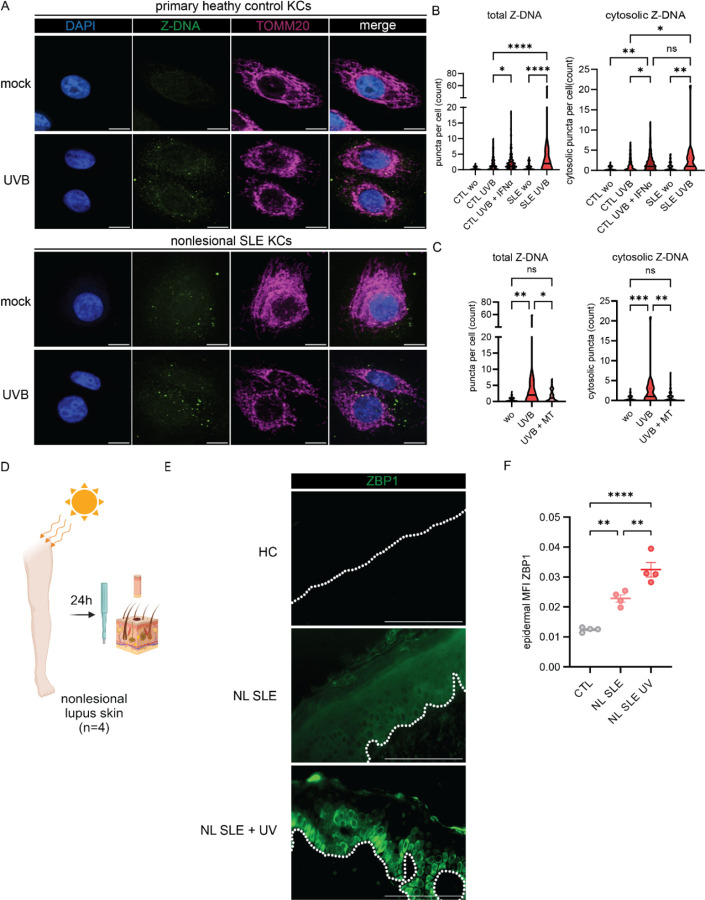
Figure 4. Nonlesional lupus keratinocytes exhibit cytosolic Z-DNA accumulation at baseline and after UVB exposure that is prevented by mitoTEMPO.
A. Representative images of confocal microscopy staining for Z-DNA, TOMM20 and counterstaining with DAPI at baseline and after UVB exposure and preconditioning with IFNα (1000U/ml for 16h prior to UVB exposure) in primary healthy control KCs (n=4) and SLE KCs (n=3). B-C. Quantification of total and cytosolic Z-DNA puncta after UVB with or without preincubation with mitoTEMPO or IFNα using CellProfiler. D. Healthy controls (HC), SLE patients +/− UVB (n=4 each group) were biopsied 24h after UV exposure. E. Representative images of ZBP1 staining in HC, nonlesional SLE skin (NL SLE) and NL SLE after UV exposure. Dotted white line indicates the dermo-epidermal junction. Scale bar =100μm F. Quantification of mean fluorescence intensity (MFI) of epidermal ZBP1 using open source CelProfiler software. Ordinary one–way ANOVA followed by Sidak’s multiple comparison test. Mean and SEM. *P<0.05, **P<0.01, ***P<0,001, ****P<0.0001.

